Multi-Value Dimensions in Apache Druid (Part 1)
Apache Druid is a high performance, distributed OLAP database that also has characteristics of a timeseries database. One feature that sets Druid apart from its competitors is the ability to use multi-value dimensions. The documentation on this feature seems to be a bit terse though, so I am going to start a loose series of posts to shed some light on questions such as:
- What are multi-value dimensions, anyway?
- What are they good for?
- How do you build a data model using multi-value dimensions?
- How do multi-value dimensions behave in queries?
- What are some real world use cases of multi-value dimensions?
The other parts of this miniseries can be found here:
Let’s get started!
What are multi-value dimensions?
A multi-value dimension is created when Druid ingests a dimension field that is in itself organized as a list, or an array. Some possible examples:
- In a JSON data set, the dimension value is a JSON array
- In a delimited file (CSV or TSV), values within one field are subdivided by a secondary delimiter.
Currently, multi-value dimensions are supported only for string values.
Why would you use multi-value dimensions?
There are a number of use cases where multi-value dimensions come in handy. For instance, imagine you run a video streaming service. Each movie can have multiple tags, or keywords associated with it.
Let’s look at a simplified example.
If you want to run this yourself as a tutorial, you can use the Imply Quickstart, or any other Druid installation that may be at your disposal.
Here’s the data snippet we are going to use:
timestamp,movie,tags
2020-01-01 00:00:00,Black Widow,comedy|cartoon|mystery|murder|superhero
2020-01-01 00:01:00,Aladdin,mystery|sci-fi|romantic|comedy|murder|kids|western|murder
2020-01-01 00:02:00,High Noon,romantic|cartoon|mystery|western|western|romantic|mystery
2020-01-01 00:03:00,50 First Dates,kids|sci-fi|horror|kids|sci-fi|romantic|sci-fi|cartoon|horror
2020-01-01 00:04:00,Alien,kids|murder|comedy|superhero|romantic|western|superhero|cartoon|kids|murder
2020-01-01 00:05:00,High Noon,murder|superhero|murder|murder|comedy|cartoon|murder|western|romantic
2020-01-01 00:06:00,50 First Dates,kids|western|western|romantic|romantic
2020-01-01 00:07:00,Black Widow,romantic|sci-fi
2020-01-01 00:08:00,Alien,cartoon|sci-fi|murder|western|sci-fi|sci-fi|sci-fi|cartoon
2020-01-01 00:09:00,High Noon,murder|cartoon|horror|superhero|western|kids|superhero|comedy|cartoon
2020-01-01 00:10:00,Alien,romantic|romantic|murder
Somebody has been watching movies and assigned tags to them. Note that the main fields of our data set are separated by , while the individual tags are separated by |. This is one way to get multi-value dimensions into Druid.
Also note that some tag lists have double entries, none of them are sorted, and each time a movie is watched a different list of tags may be associated with it. These are all quirks in the data that we will look at in later posts.
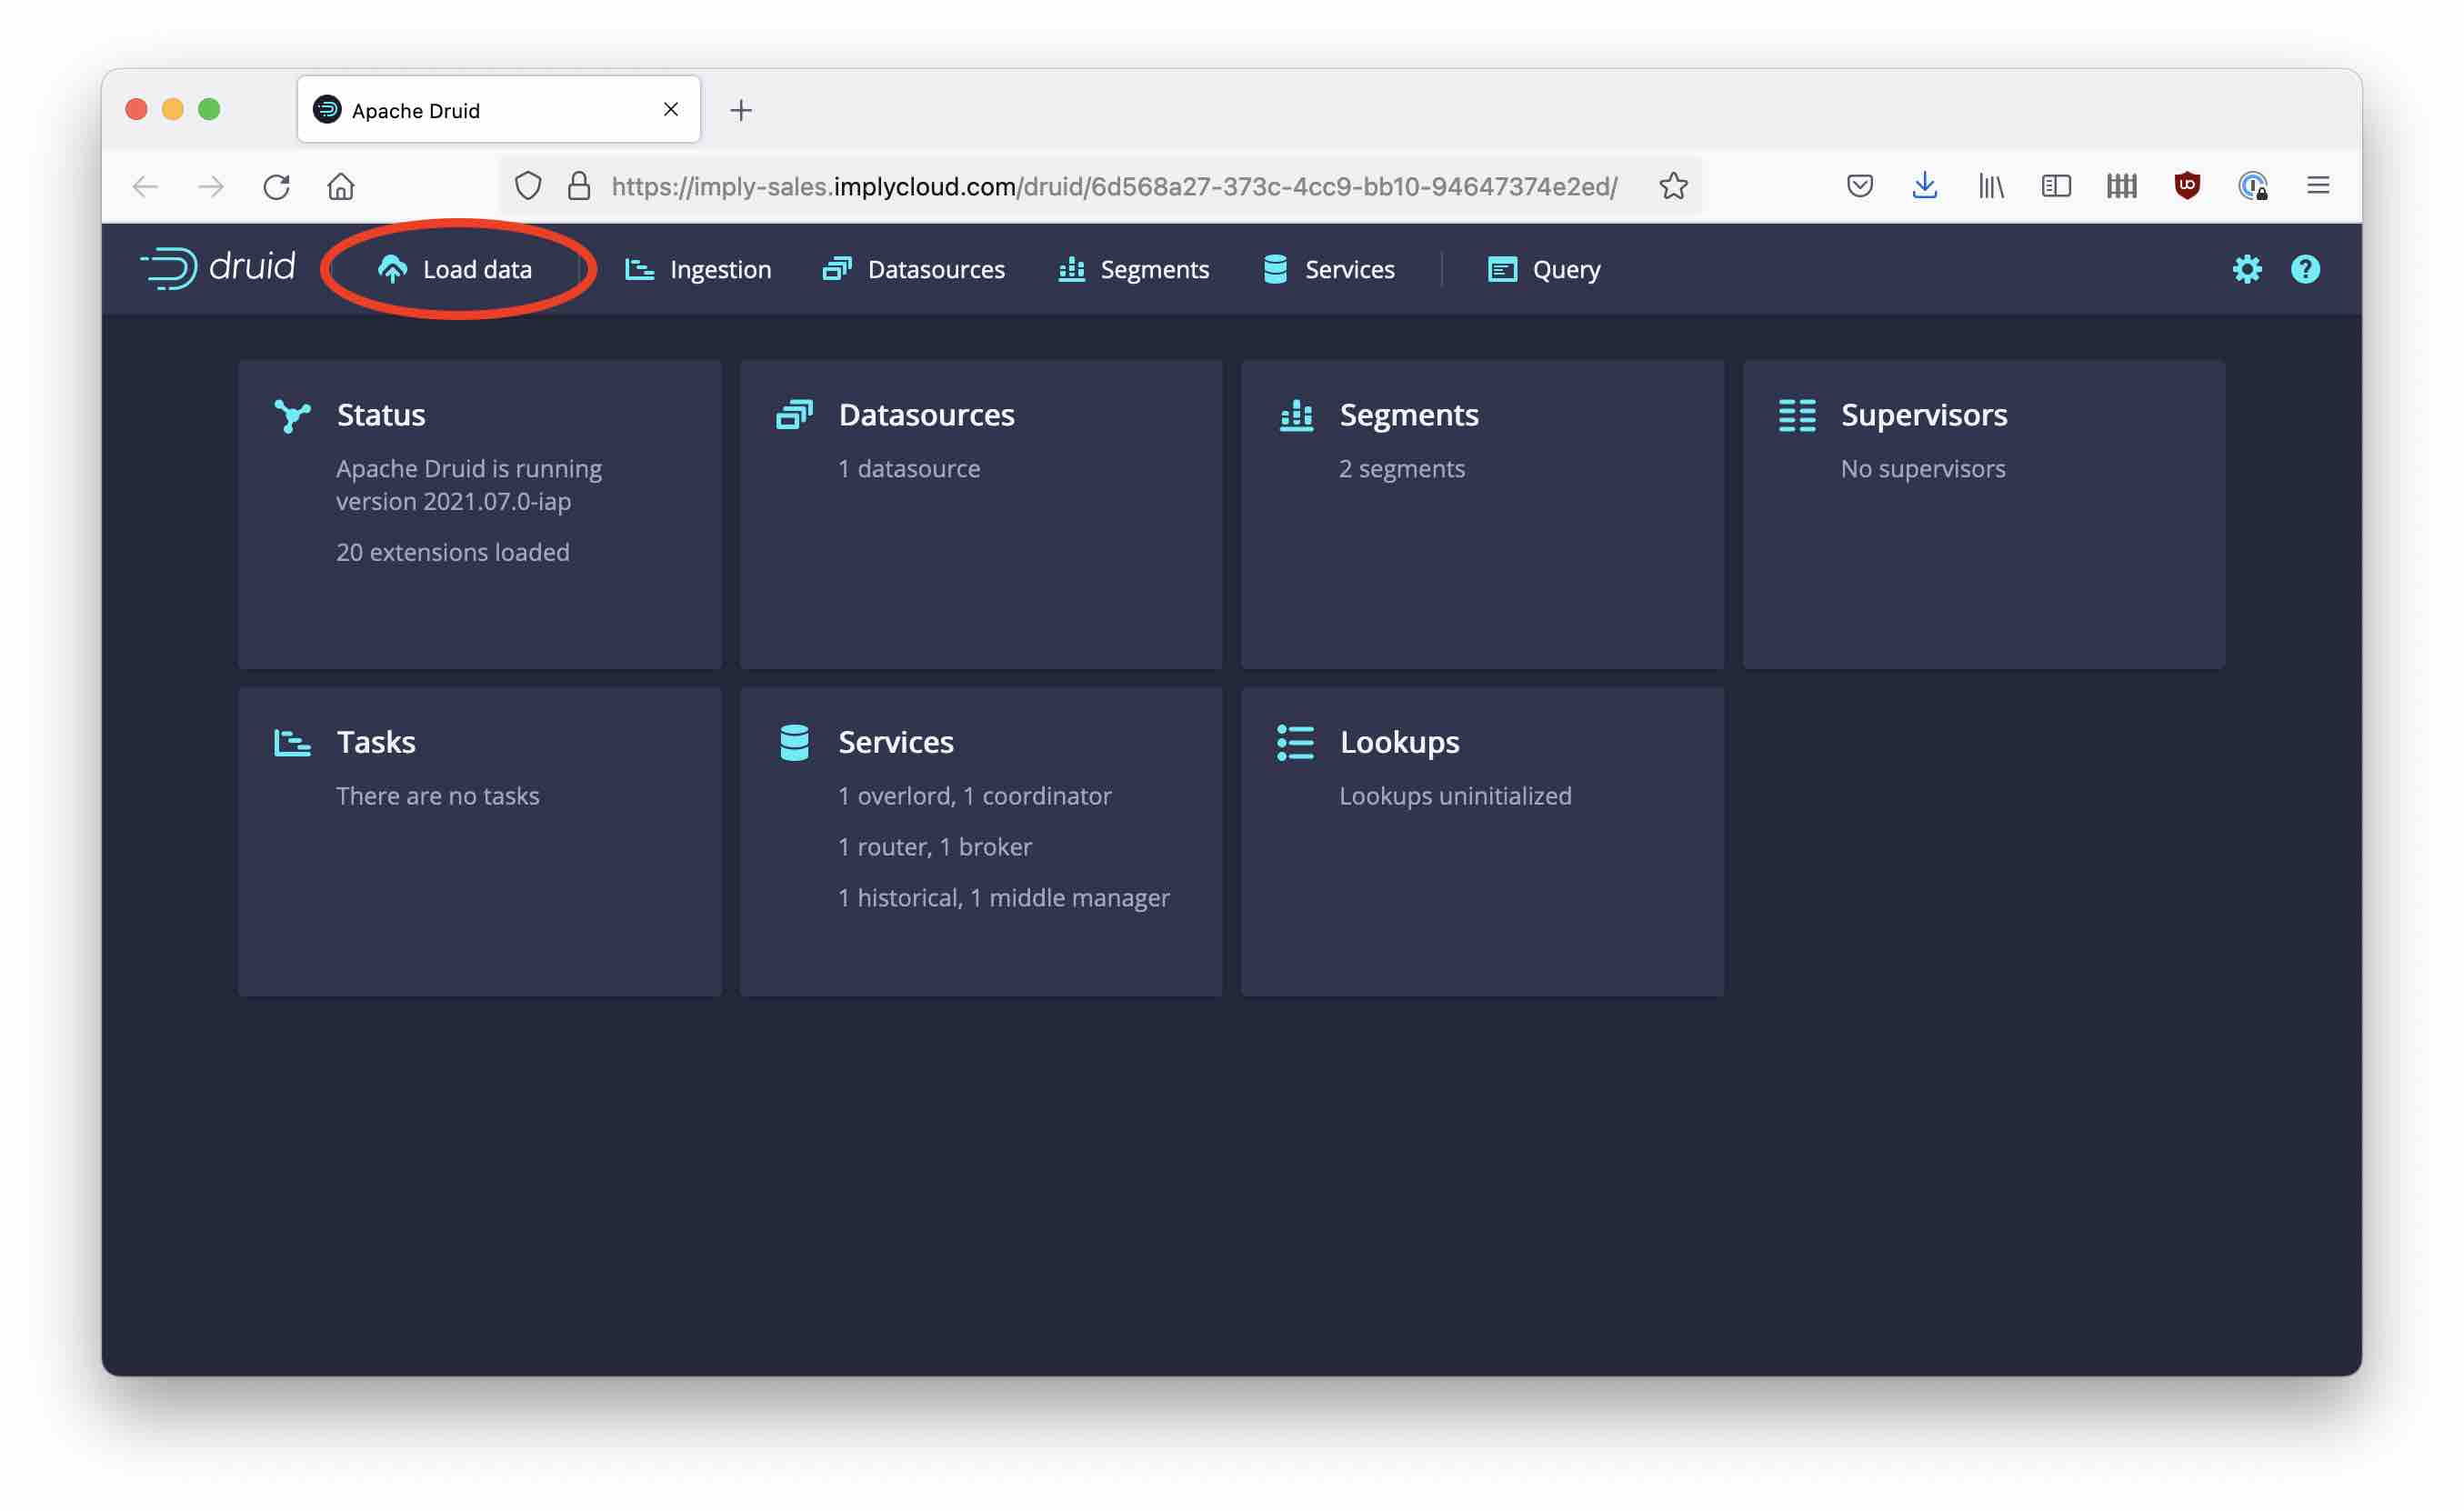
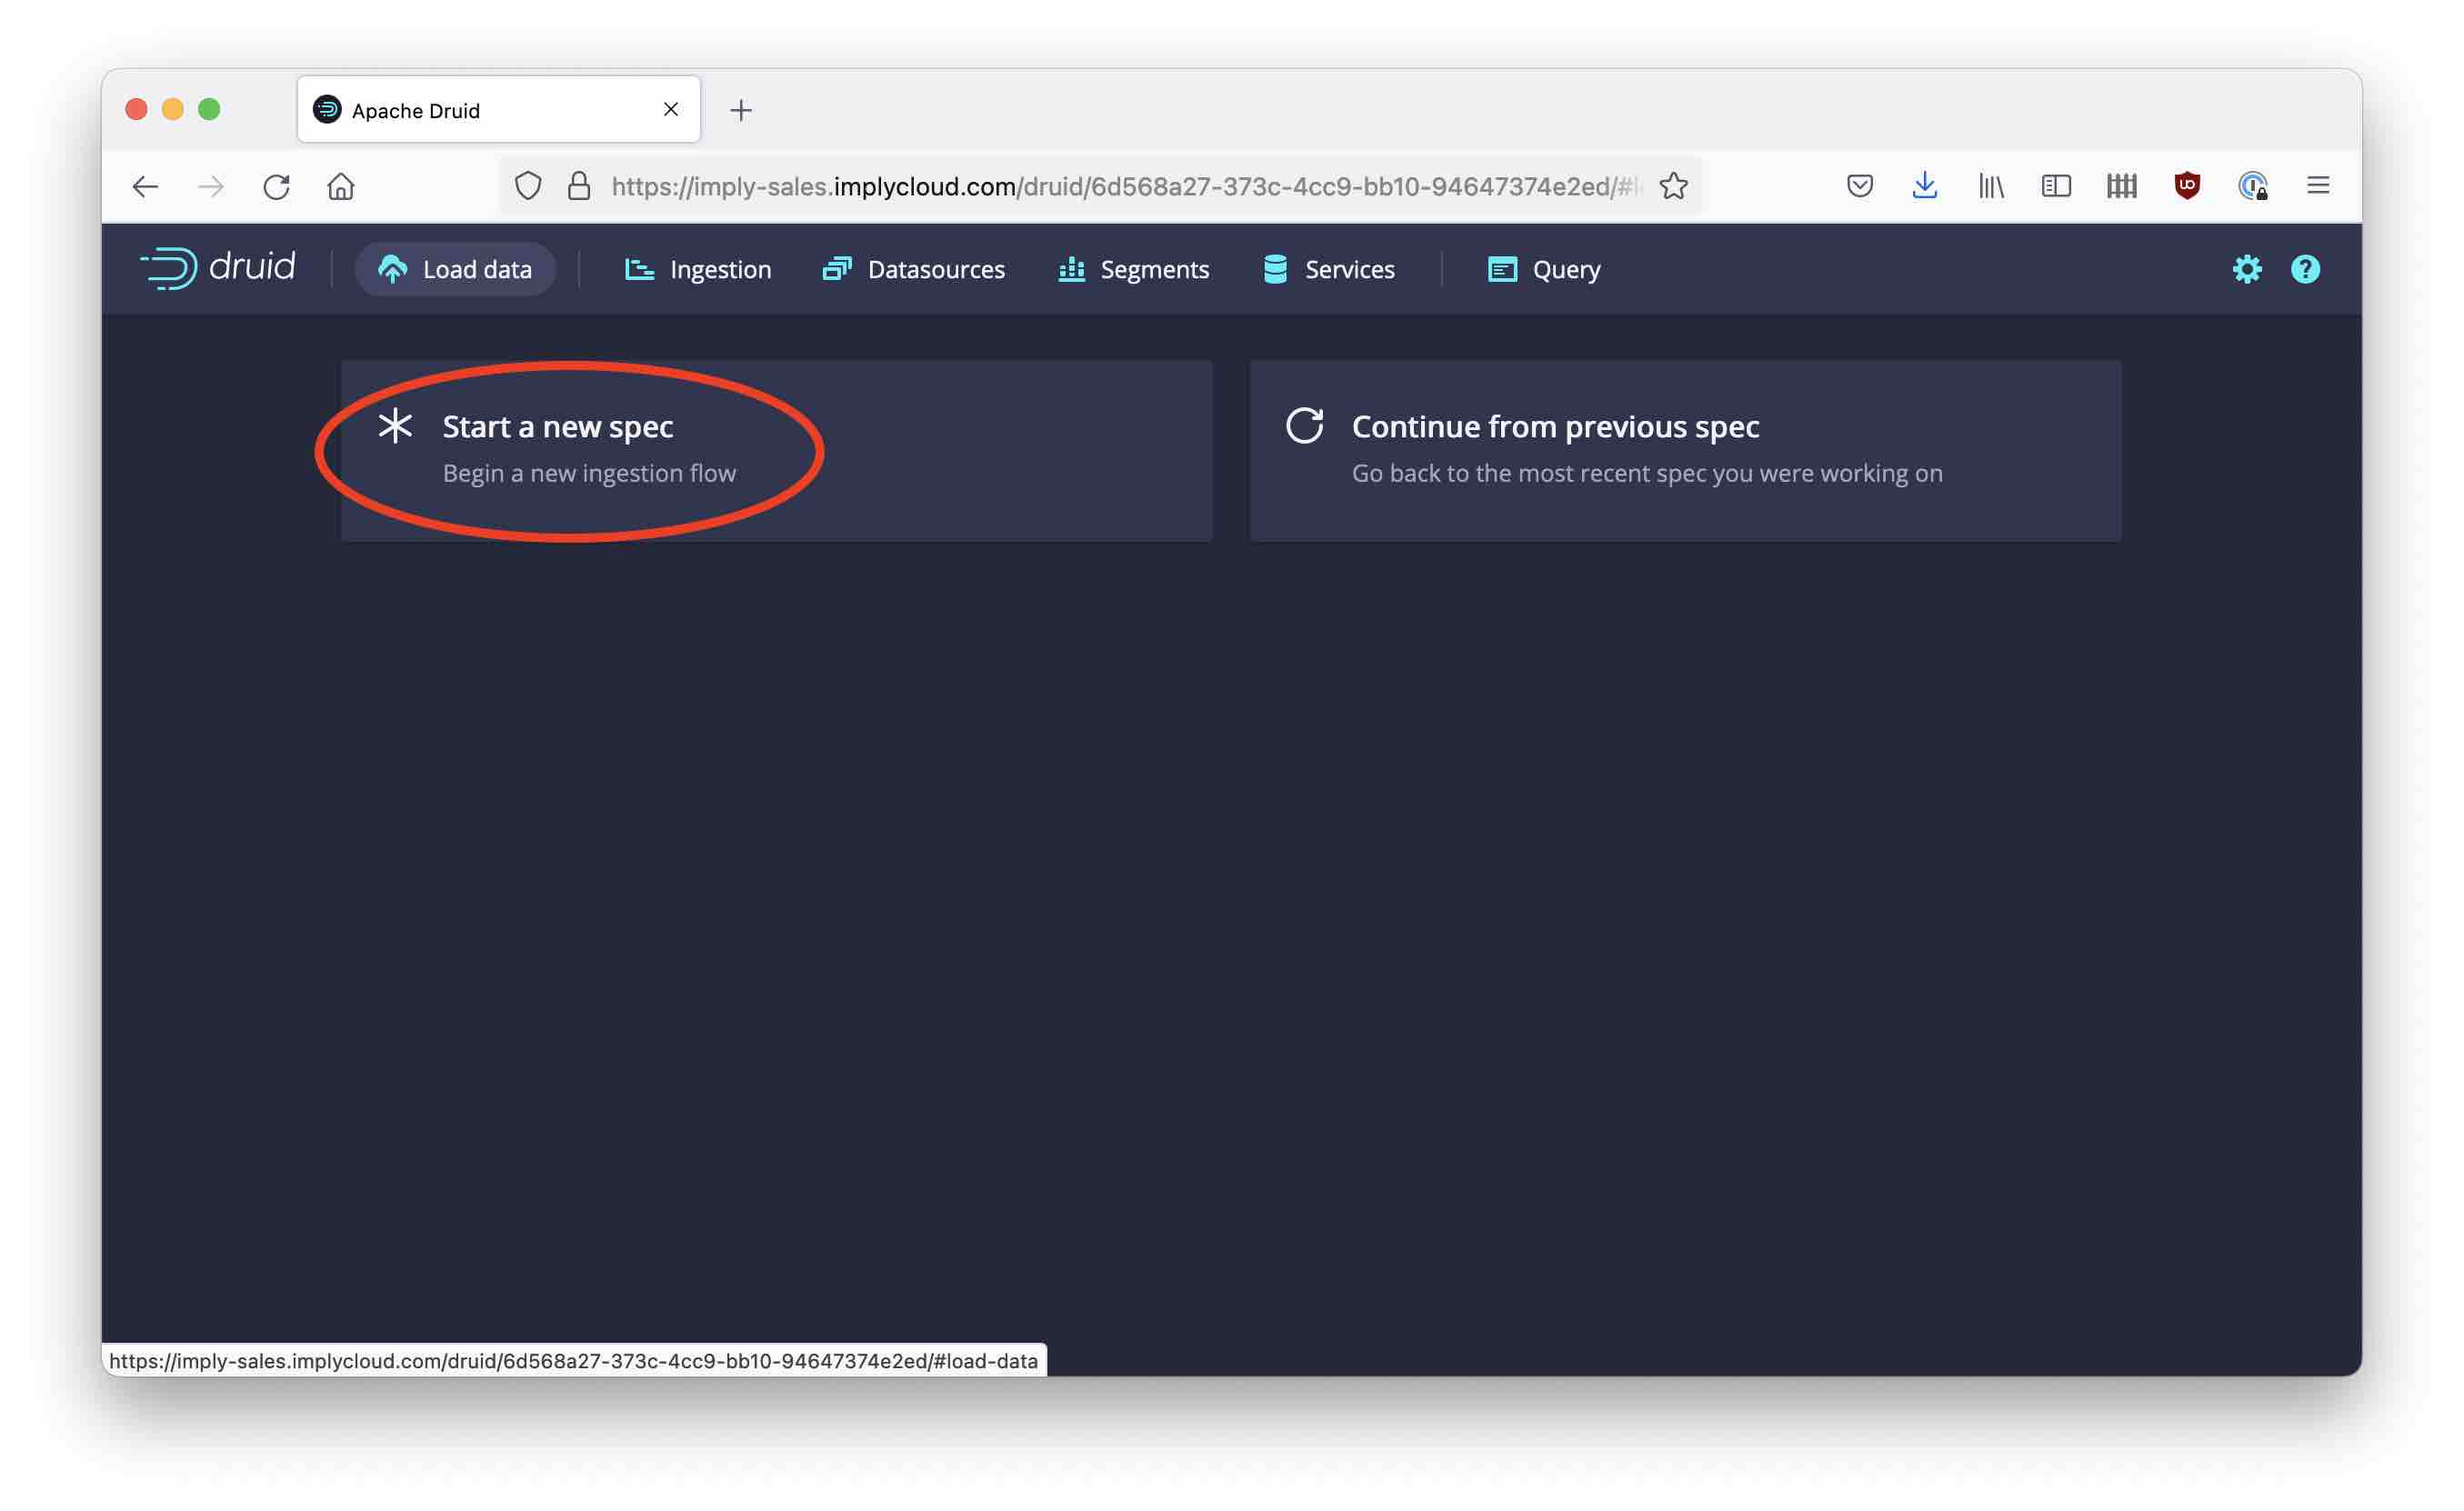
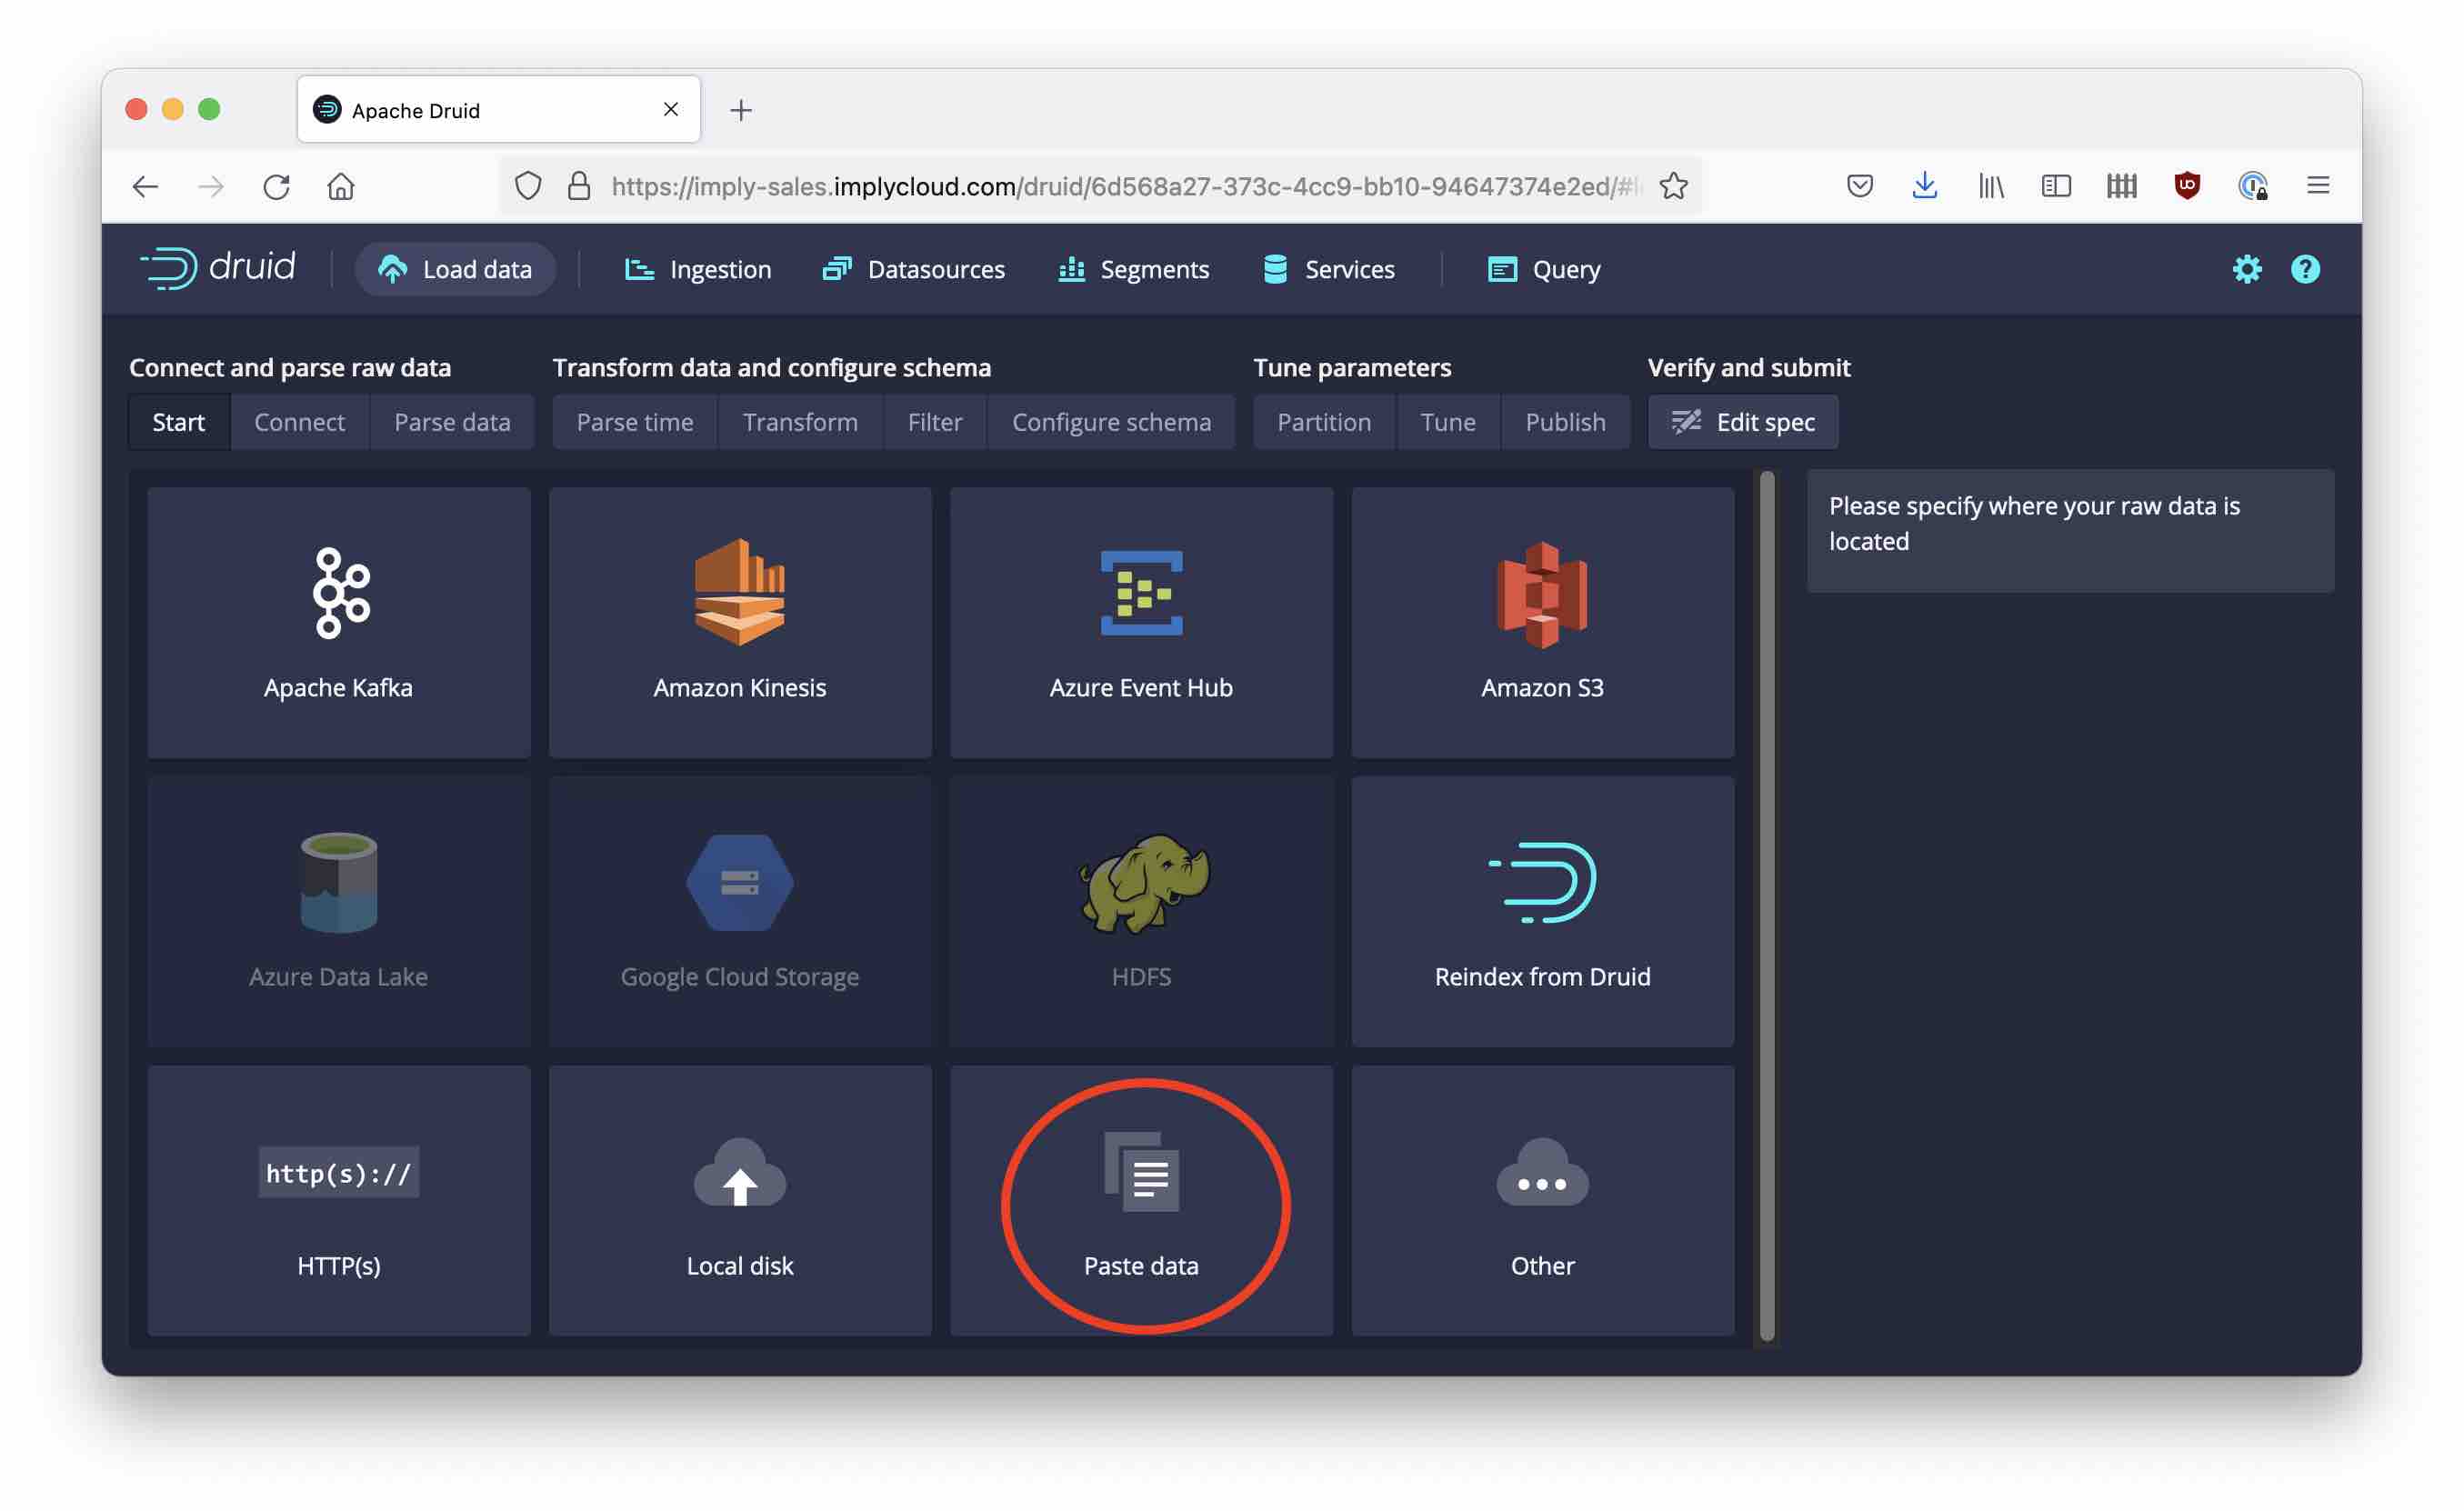
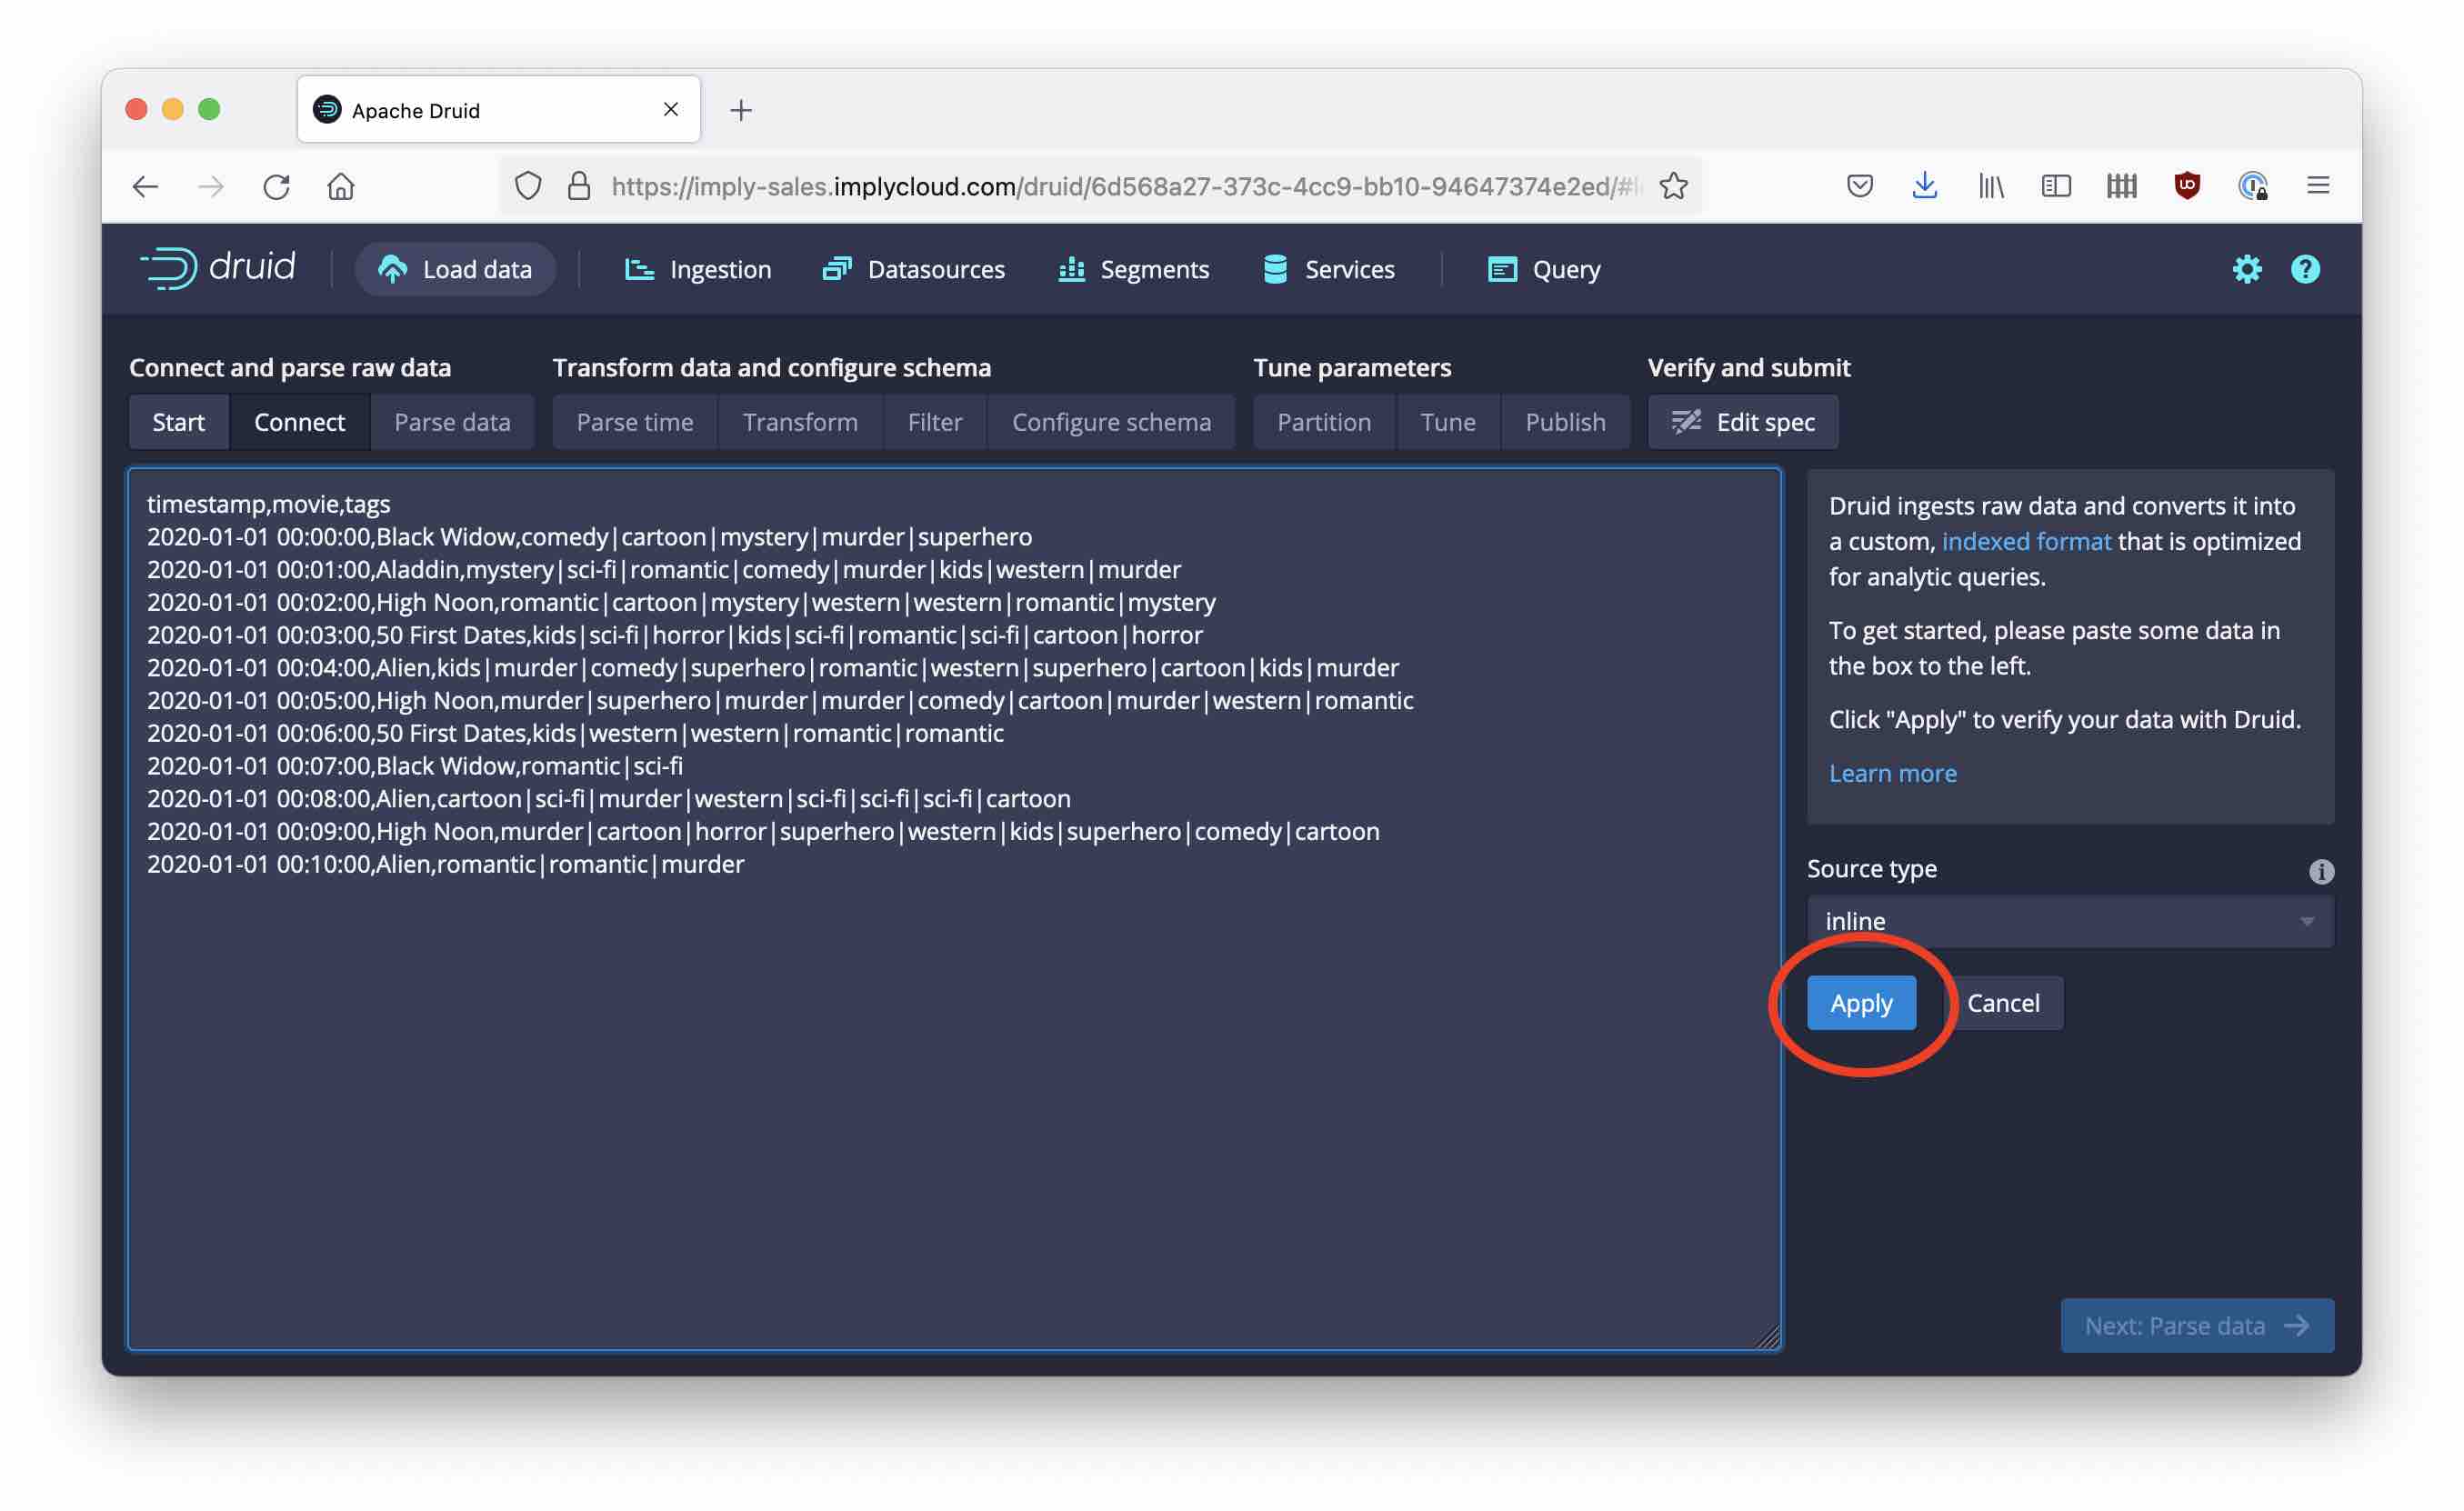
Let’s see how we can get those data into Druid. Go to the Druid console and invoke the Load Data wizard. Hit Start Spec and select Paste data as the input source.
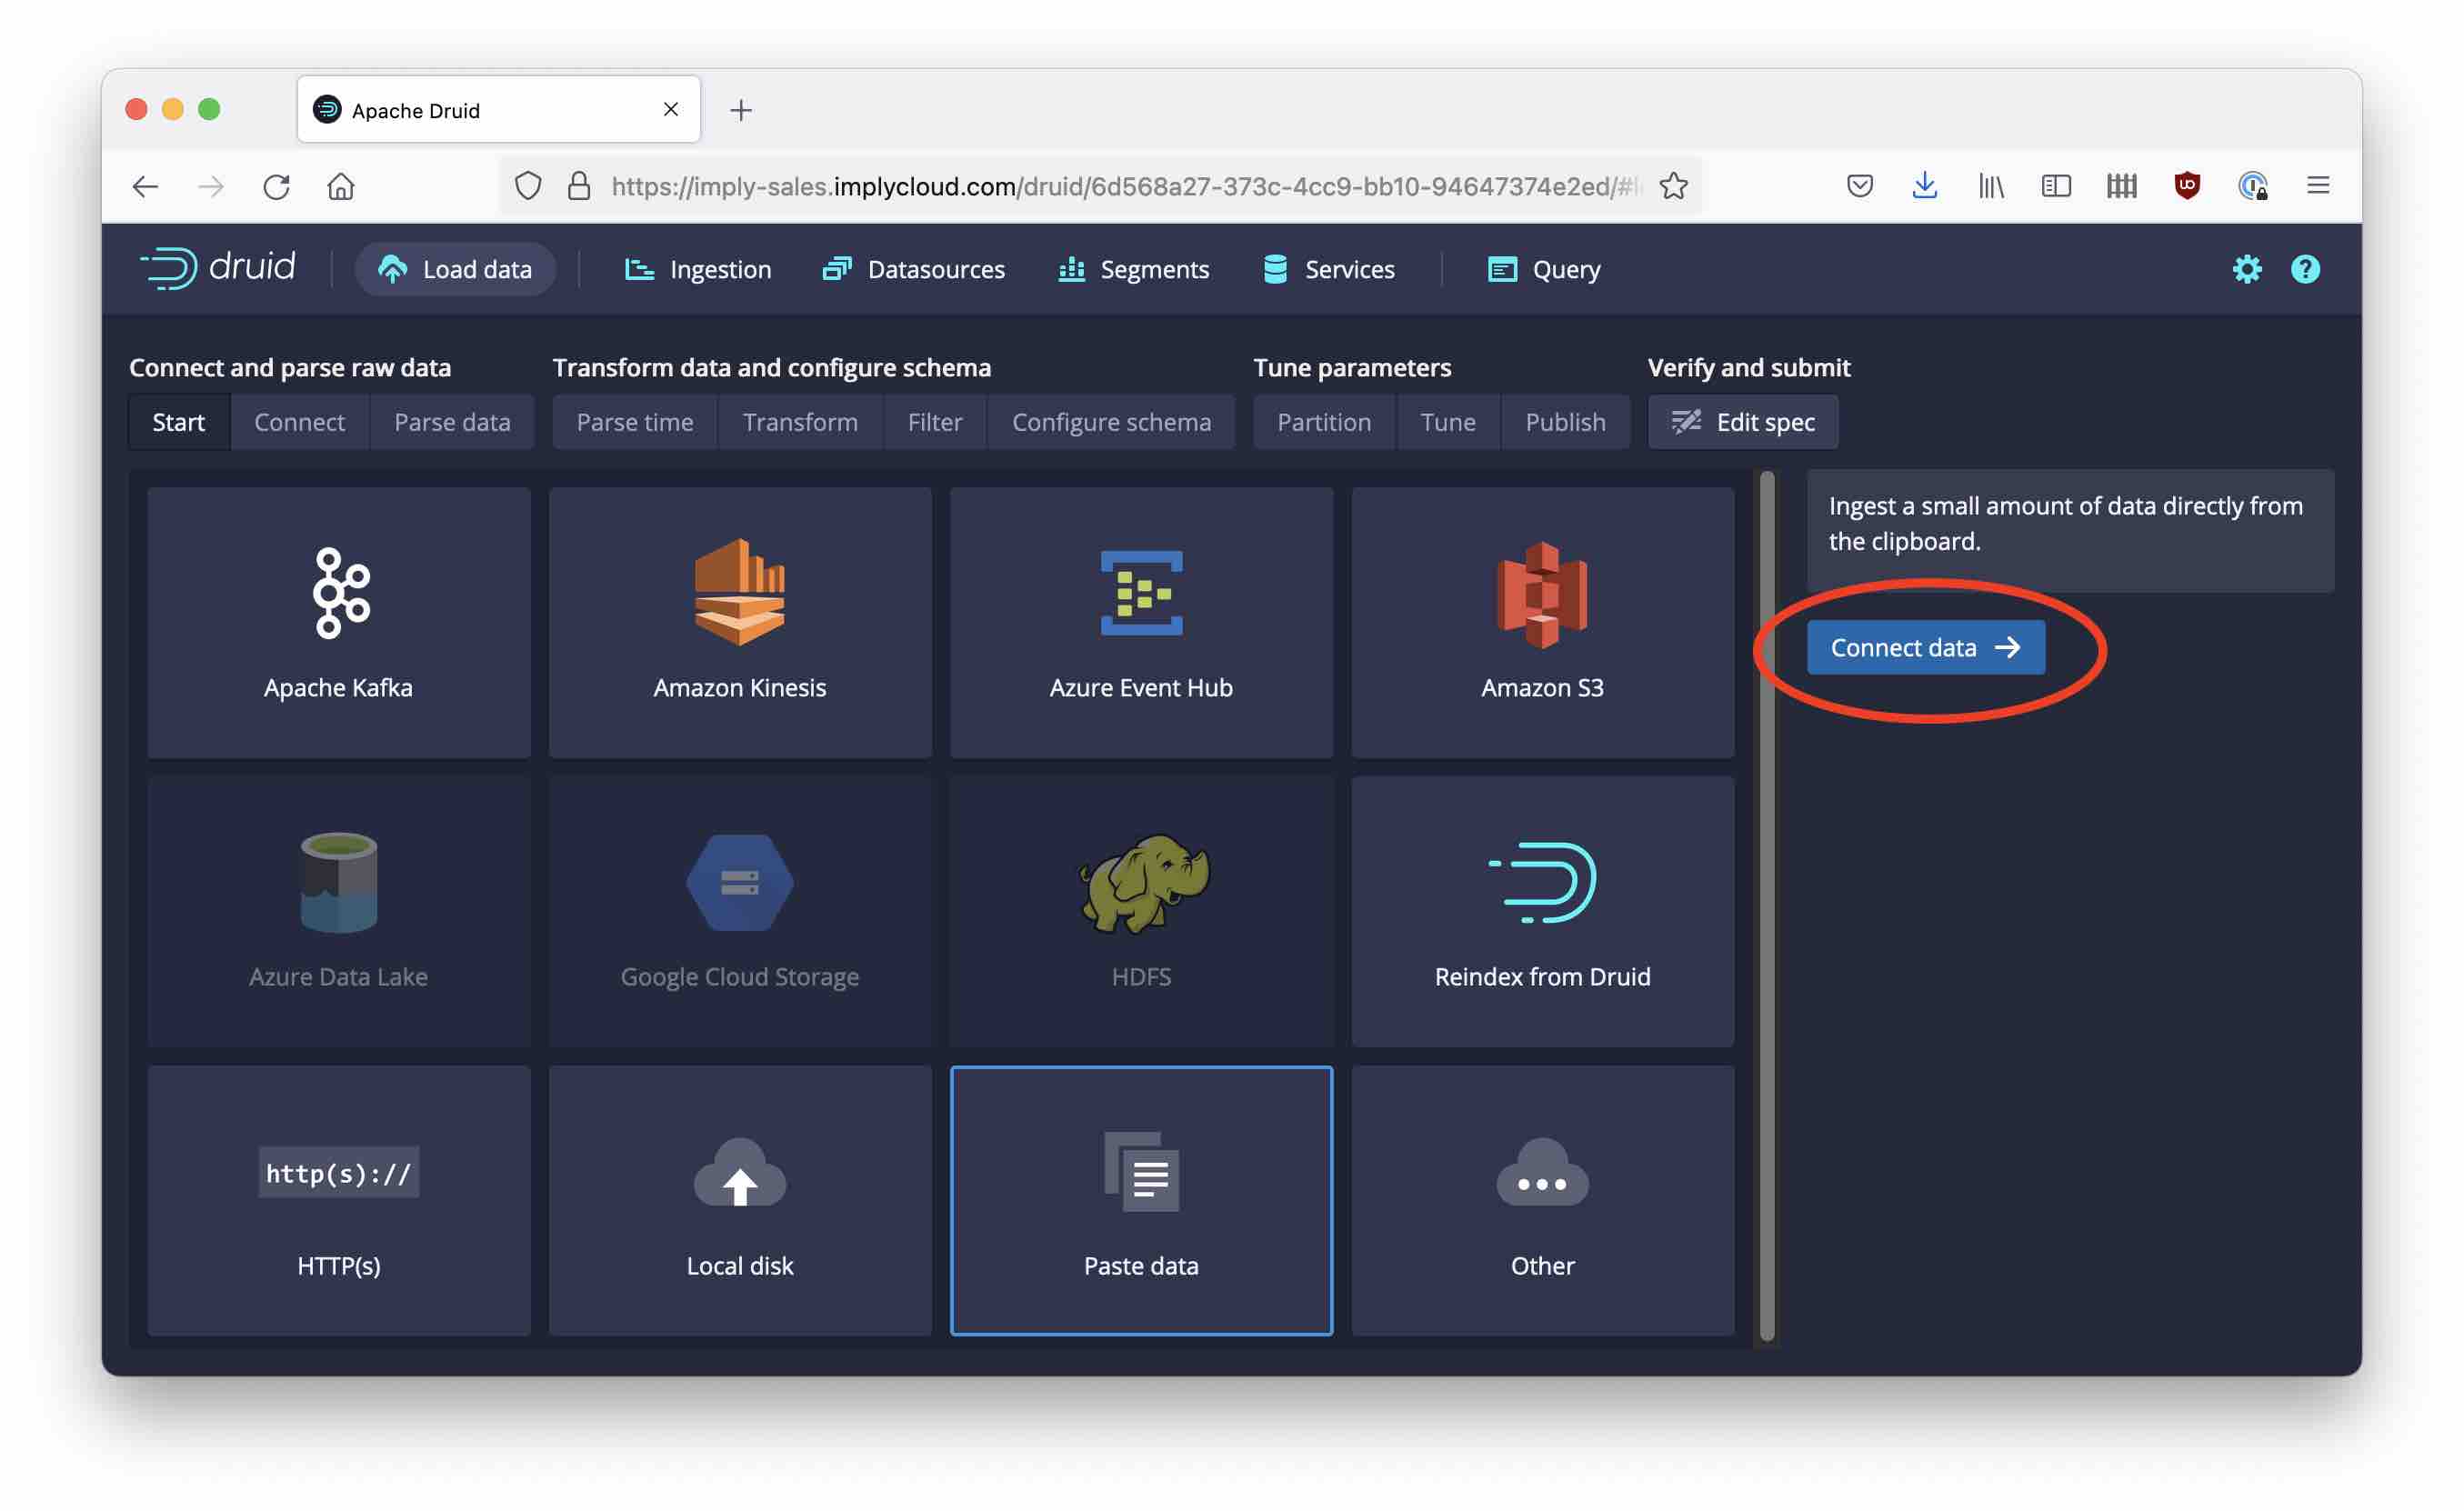
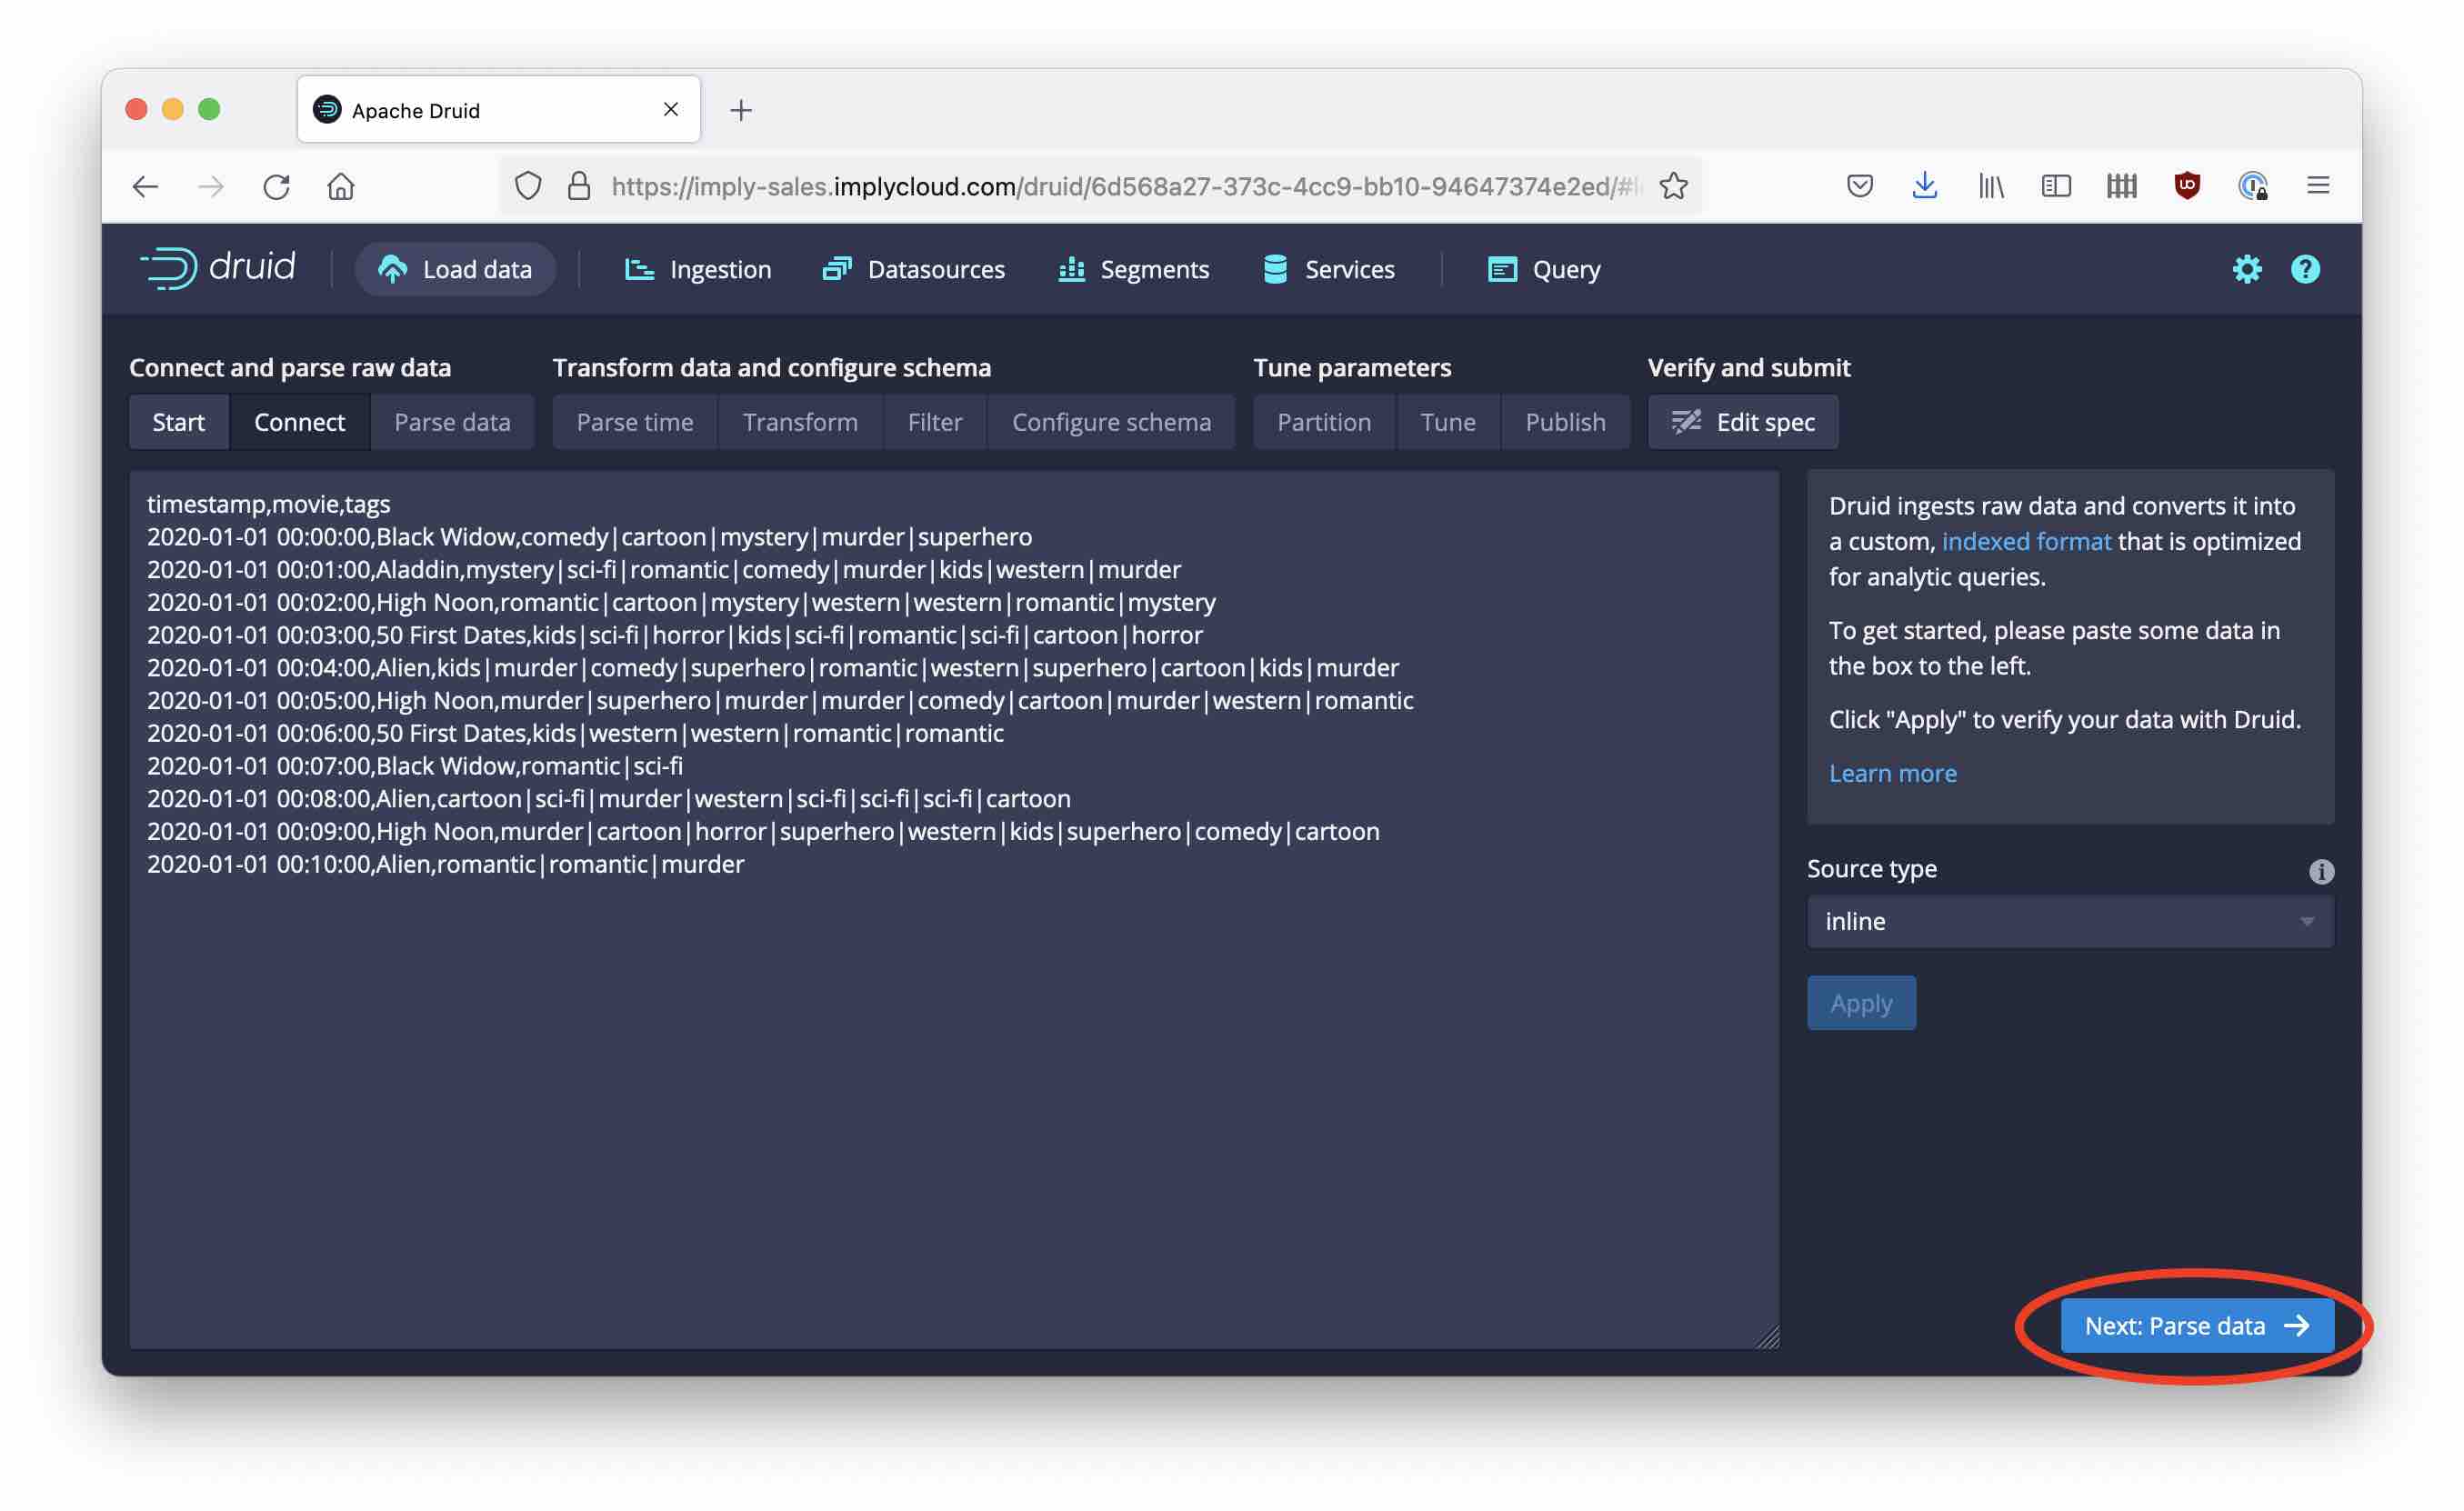
Hit the Connect data button and paste the snippet from above into the editor field. Click Apply and then Parse data to continue.
Now we need to configure the parser. In many cases the Druid wizard can do this automatically but in our case some manual intervention is needed. This is because we have two kinds of delimiters in the source data, which confuses the automatic parser.
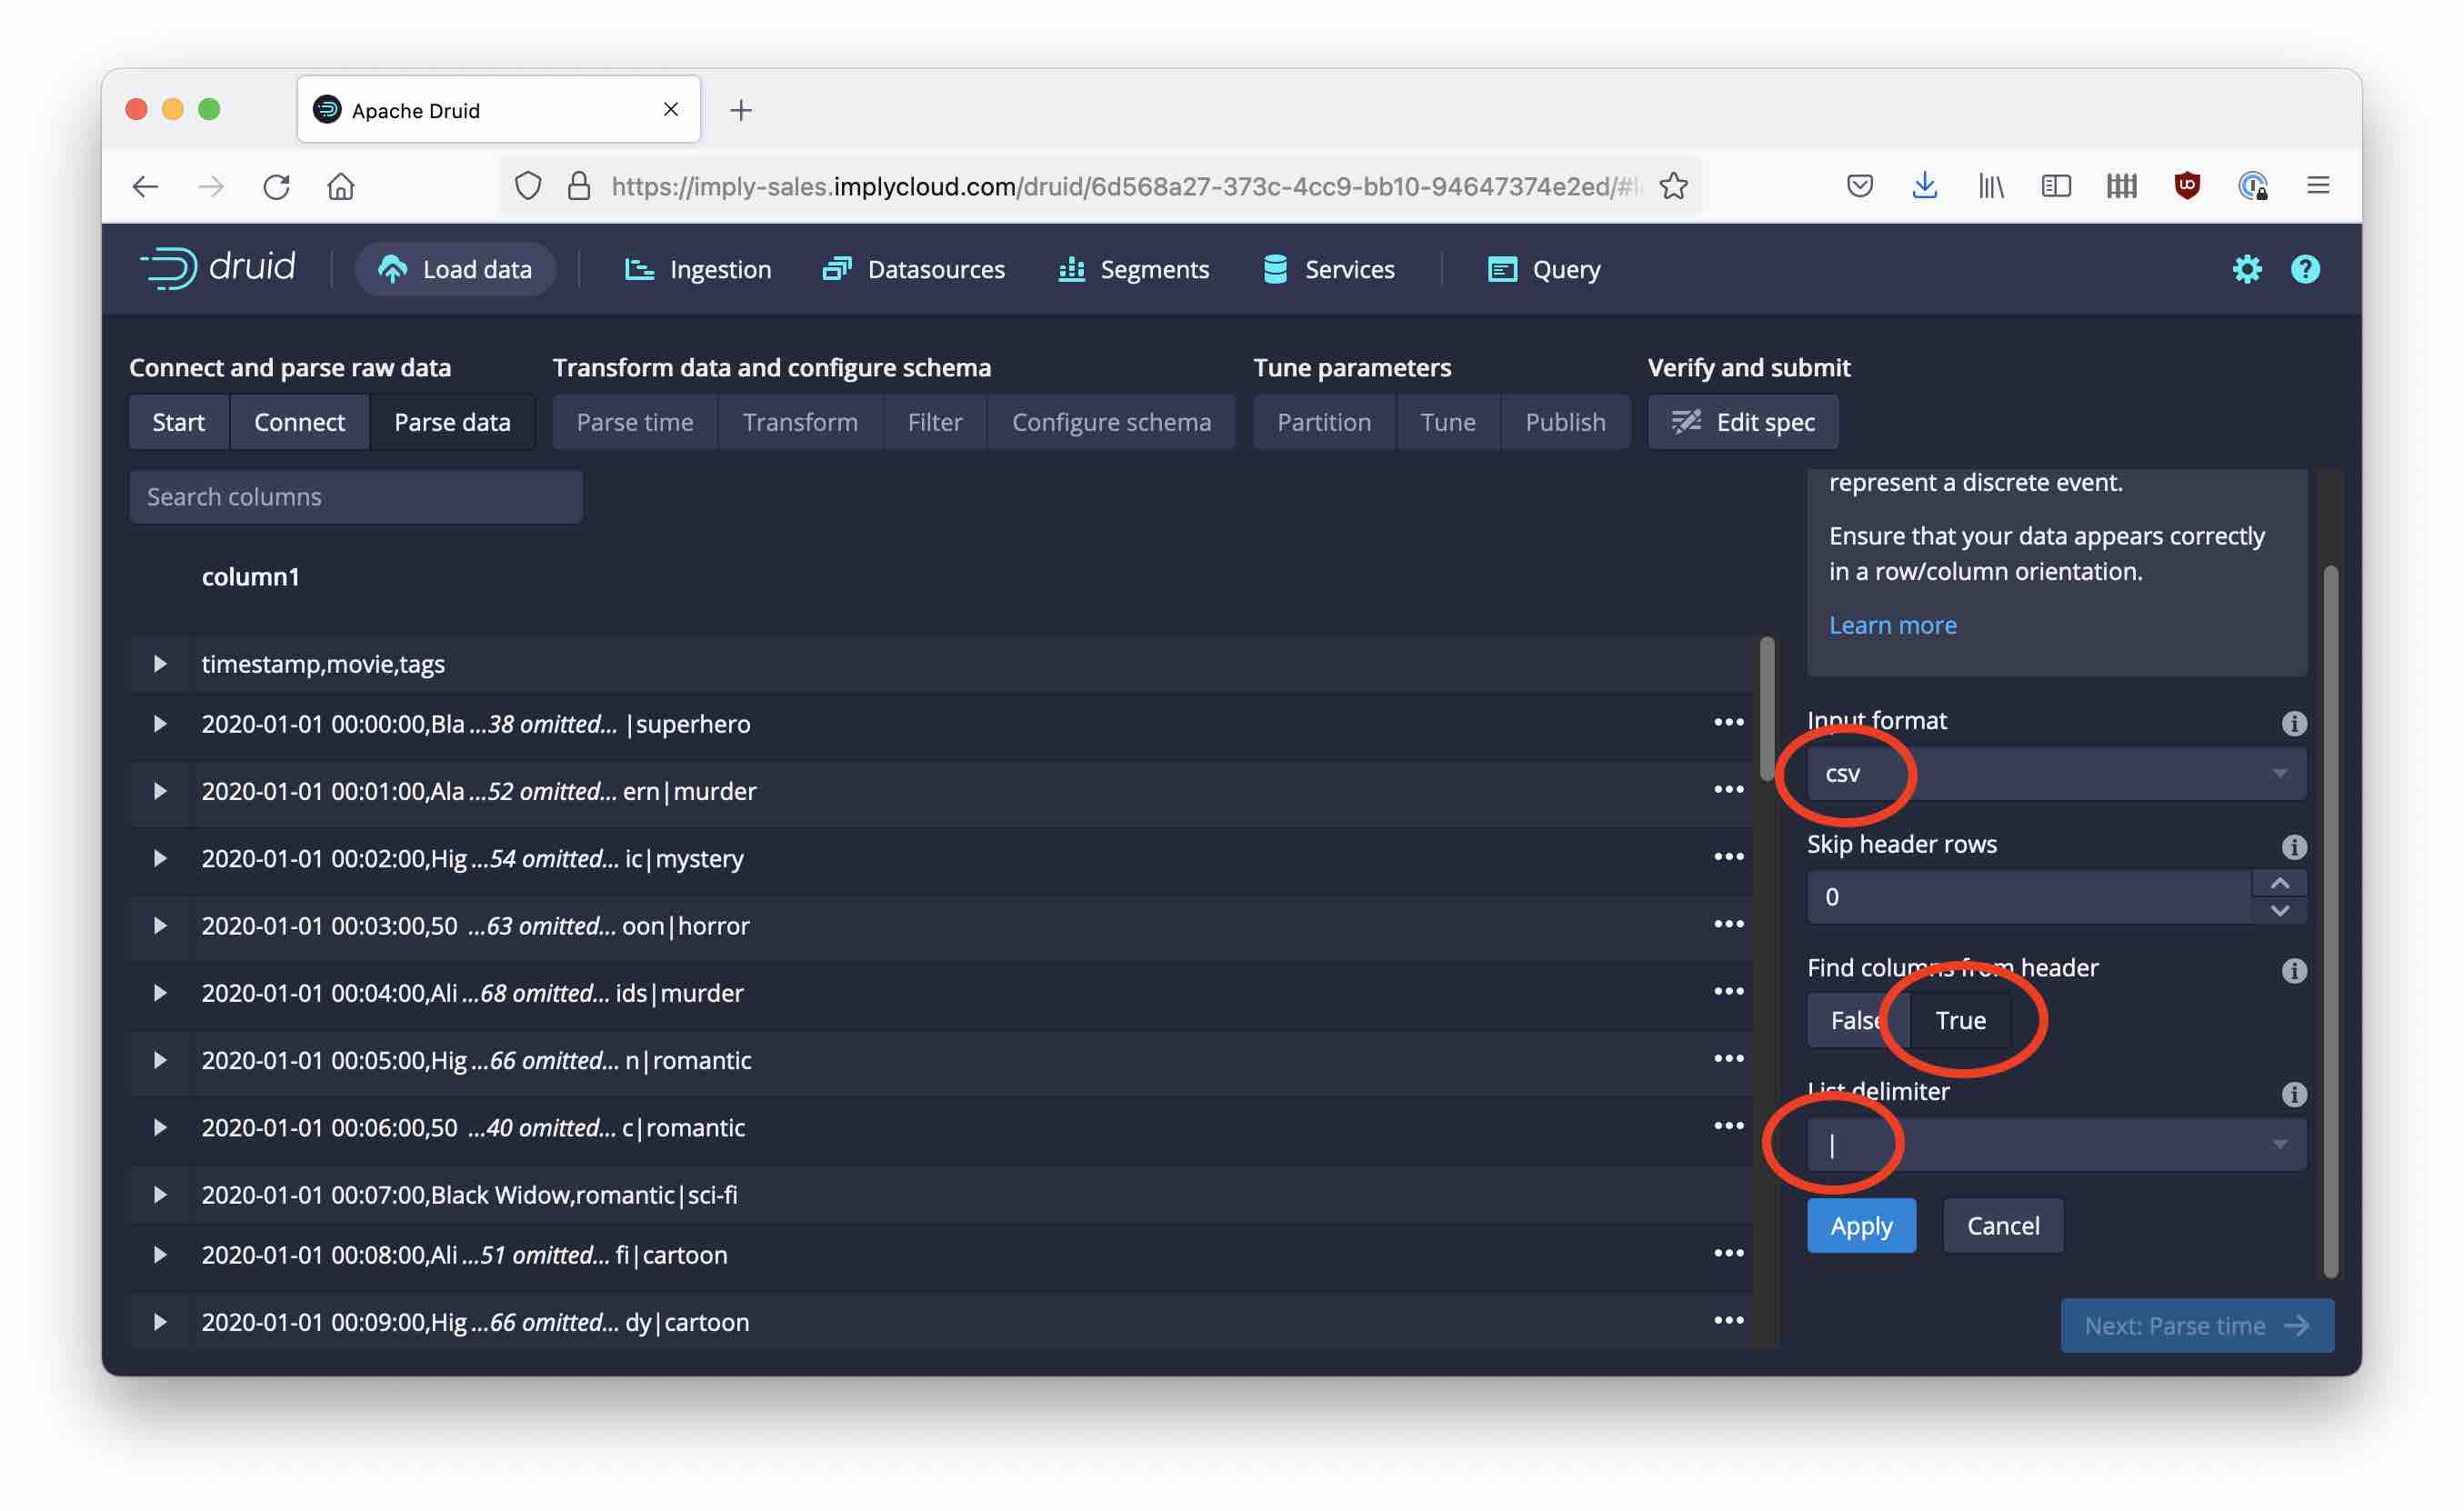
I’ve configured three settings here:
- Changed the Input format from regex to csv
- Set Find columns from Header to True
- Set List delimiter to
|(the pipe or vertical bar)
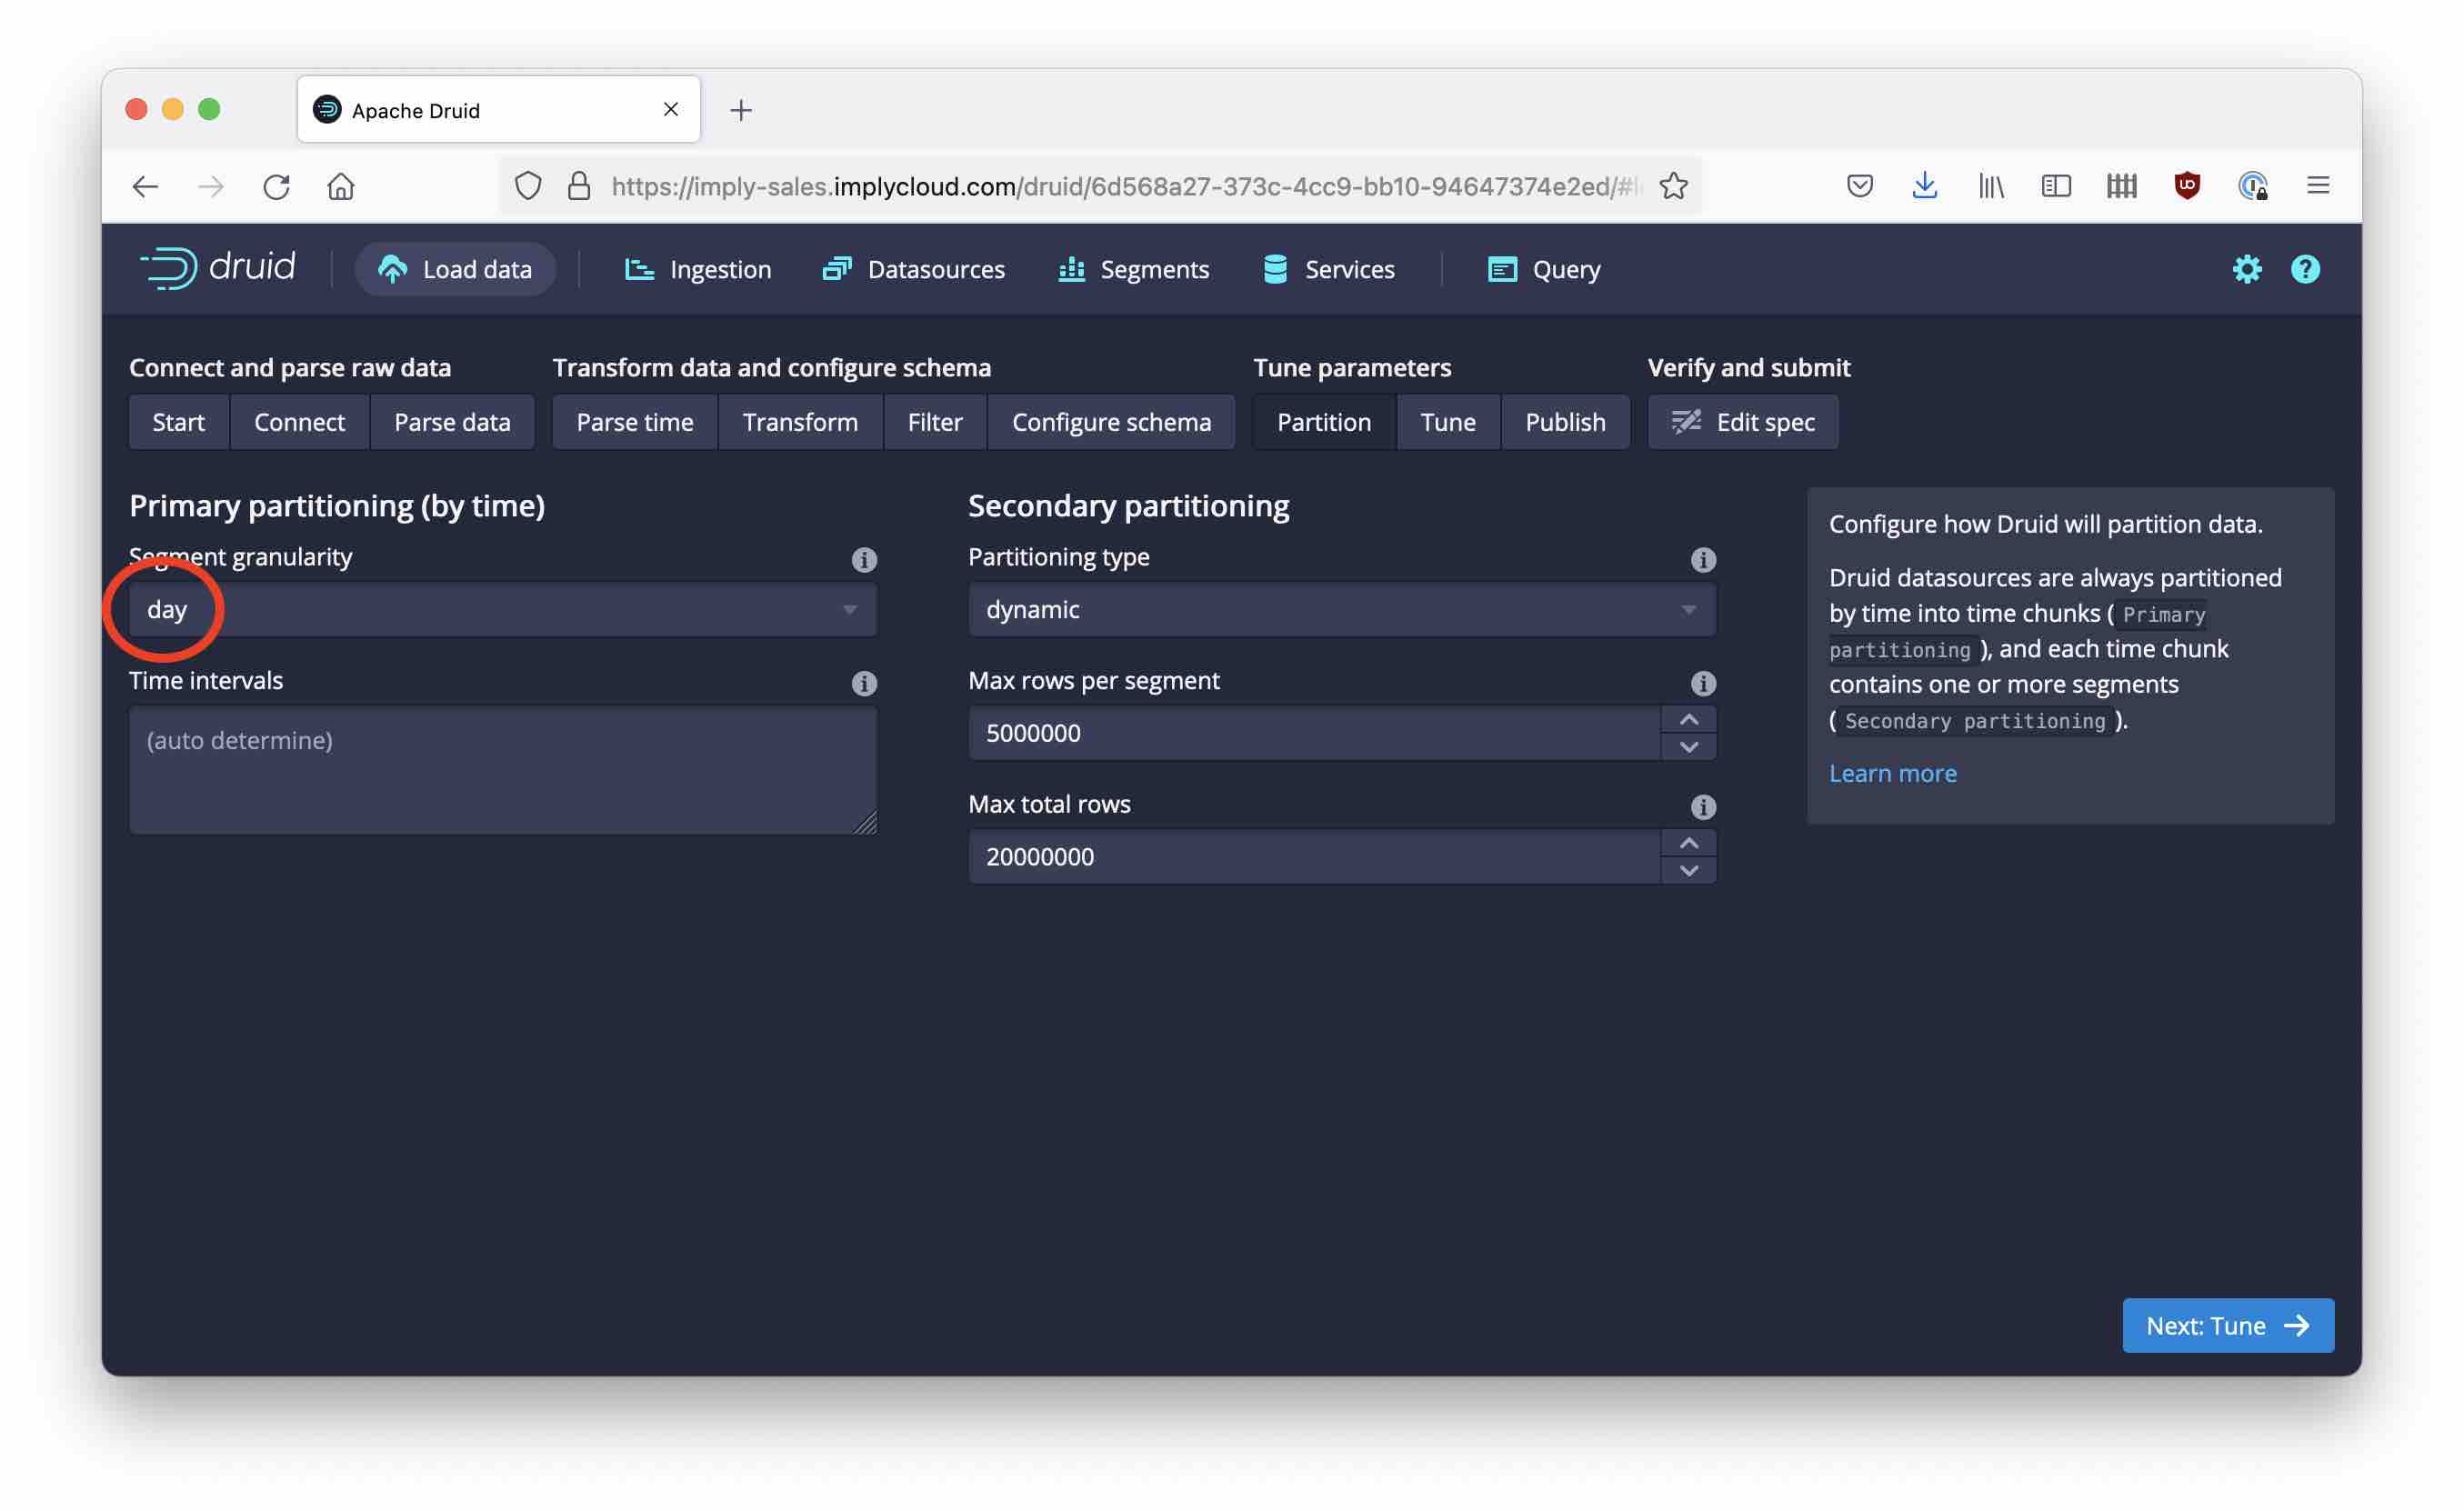
From here, click through the screens without making any changes except on the Partition page where you select daily segments.
Submit the ingestion task and wait until it is done. When it has finished, click the magnifying glass icon next to the task status:
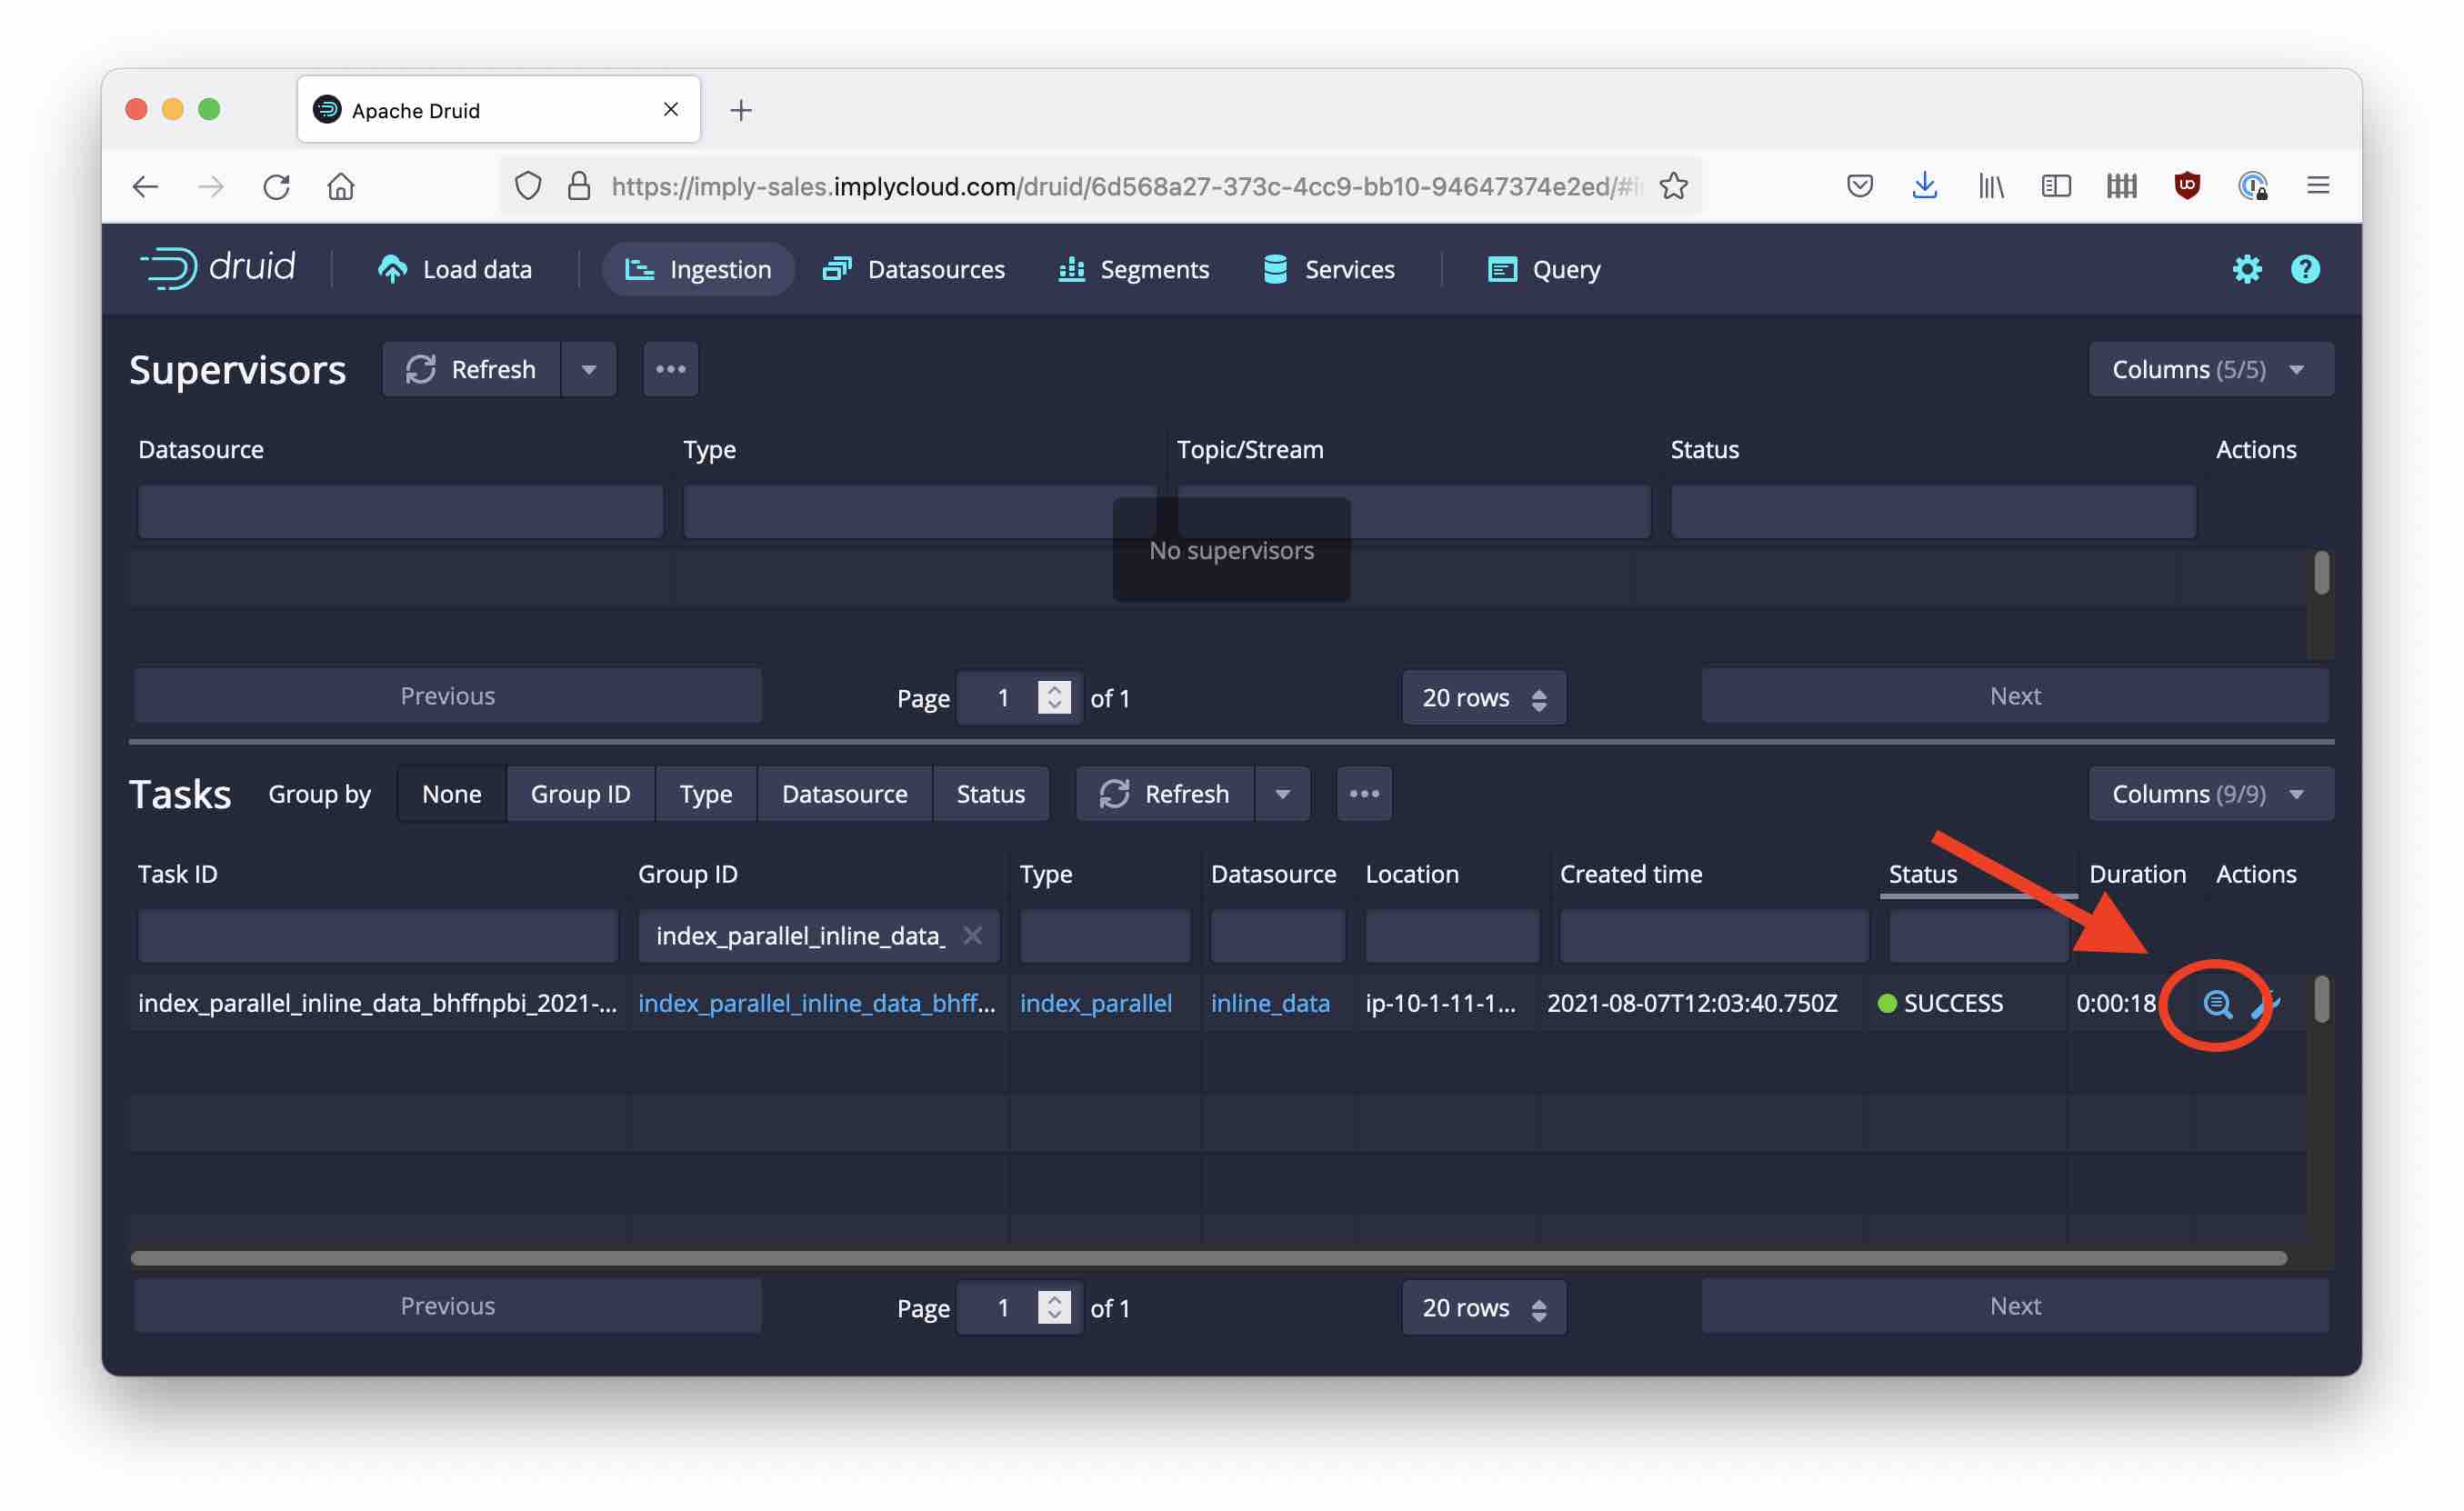
Here you can learn a lot about the task that just finished. The popup is also good for examining running tasks. Let’s take a closer look at the final ingestion spec for this task by clicking Payload:
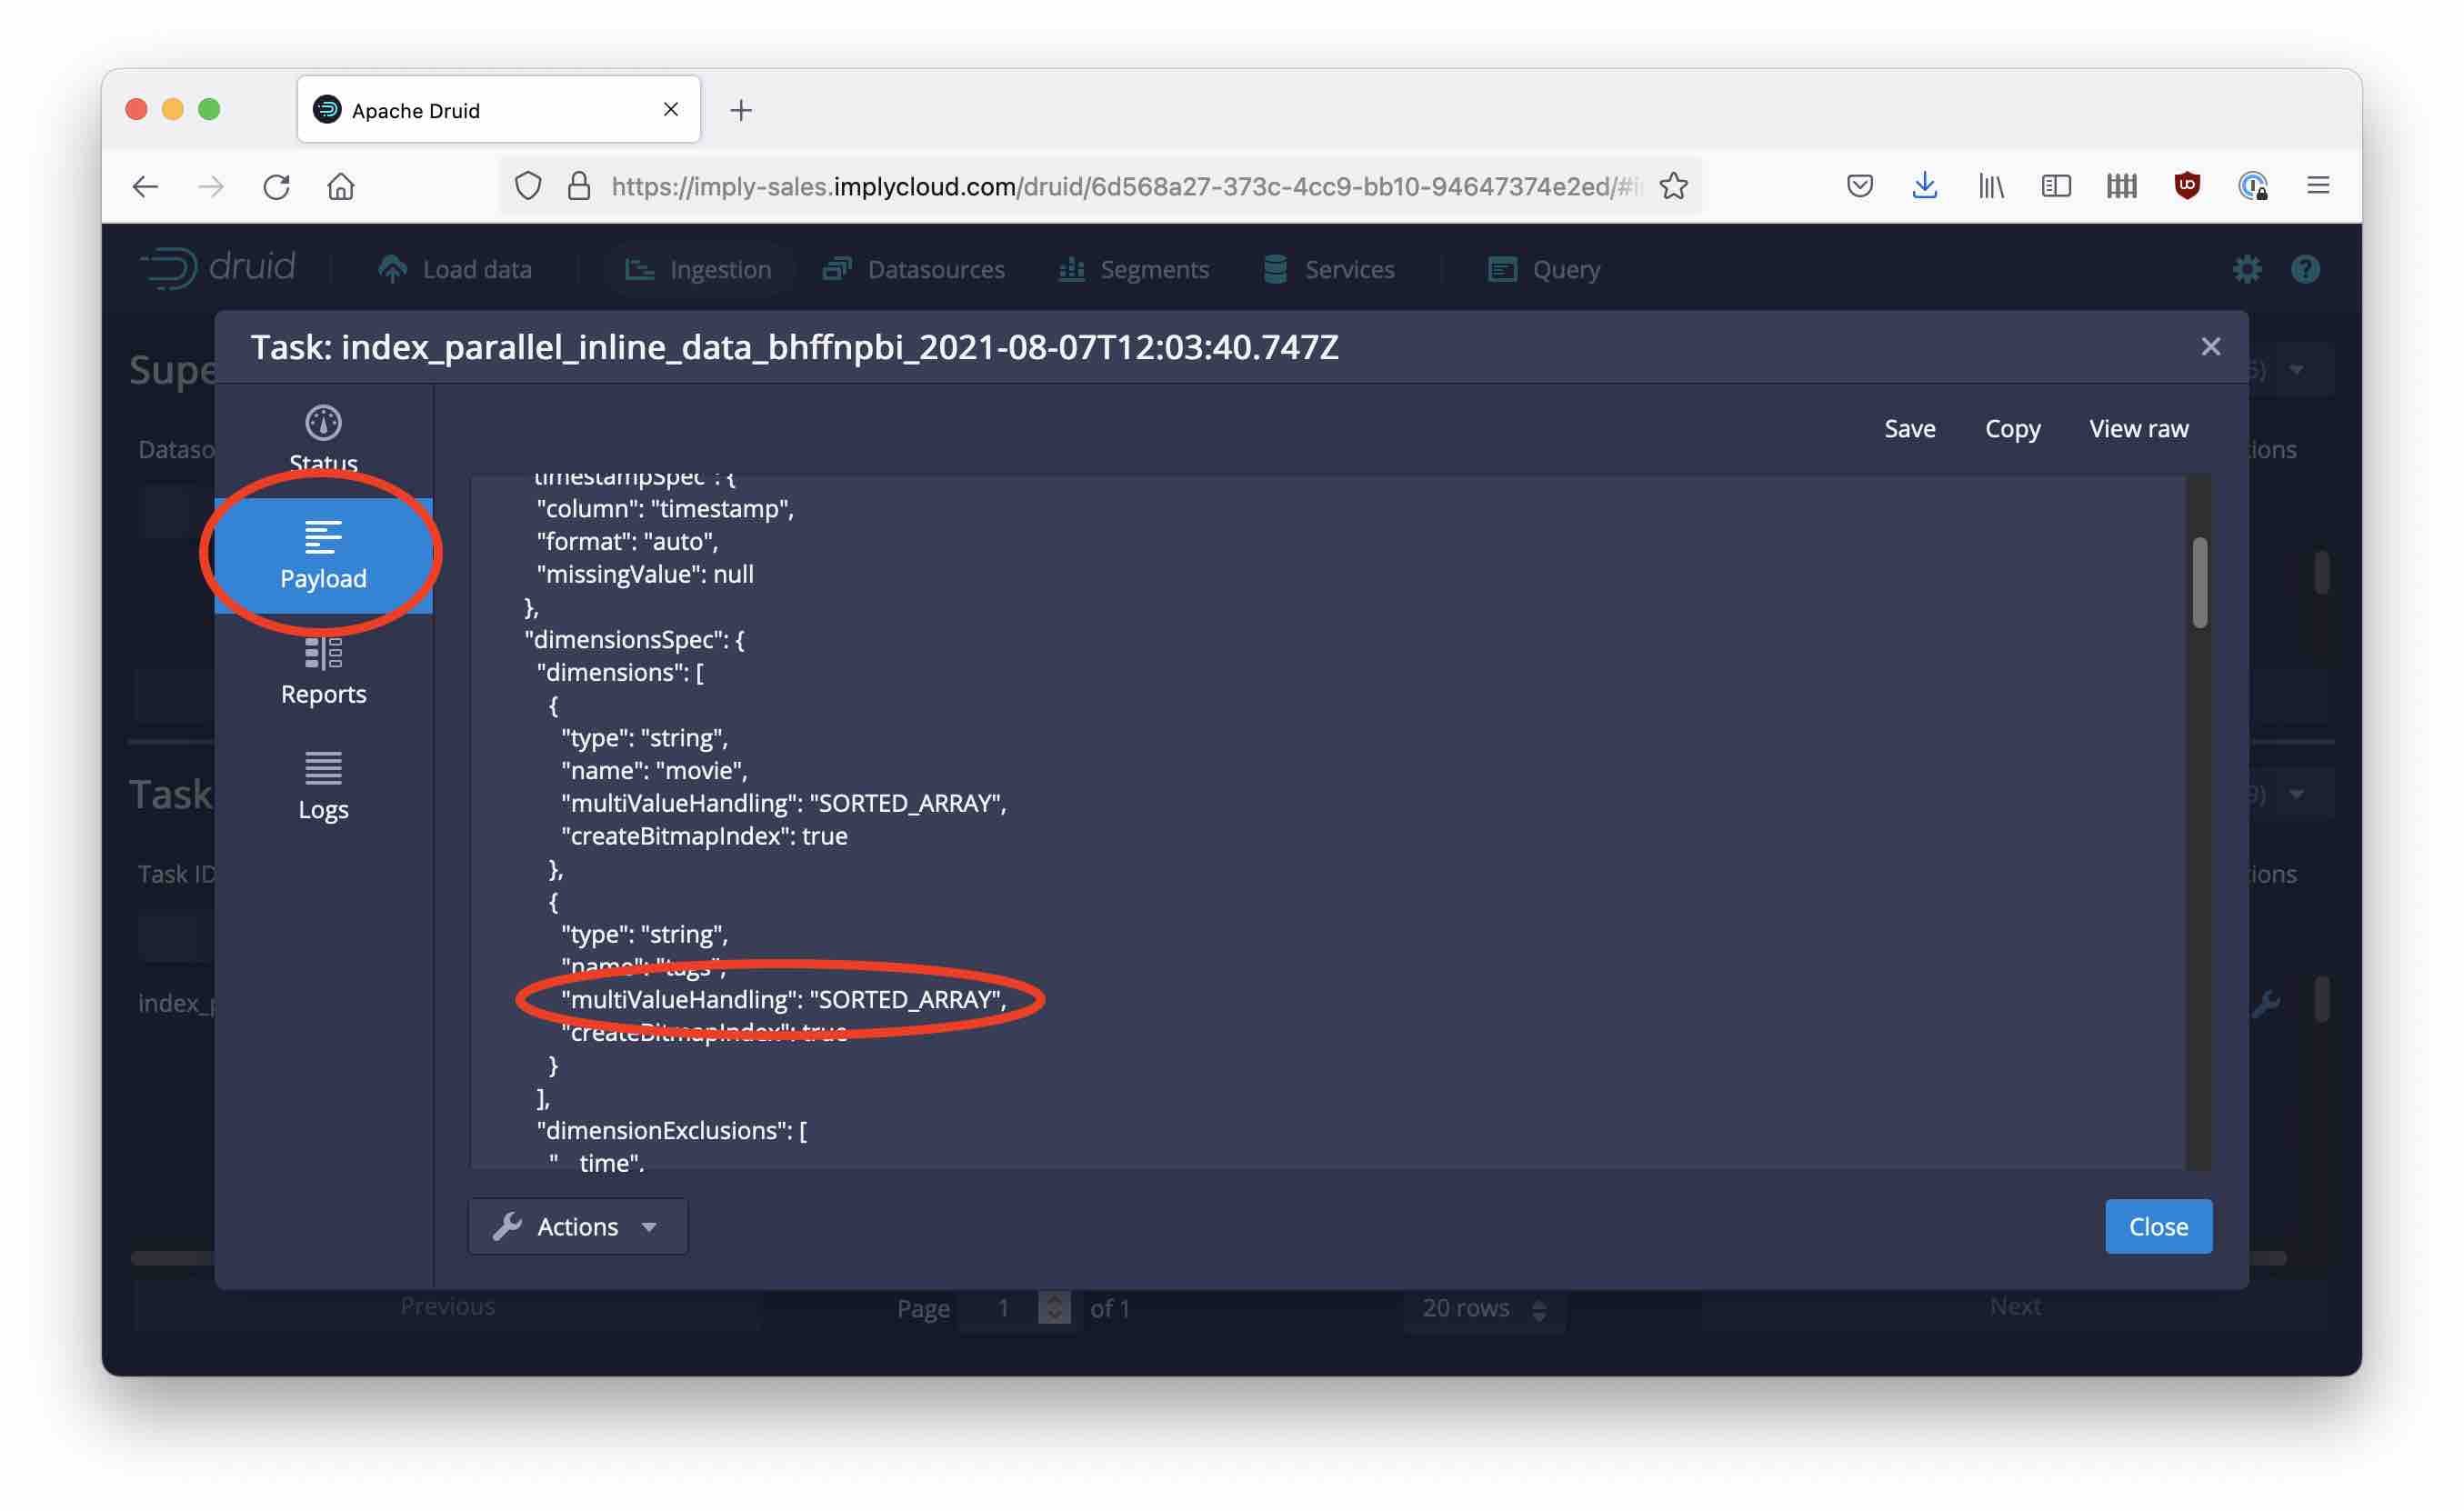
This is interesting: In the ingestion spec, all of a sudden a new field "multiValueHandling" came into life. In the future, we will have to examine what this field does and how it can benefit us.
But for now, let’s start querying these data. Go to the query wizard and issue a GROUP BY query like below.
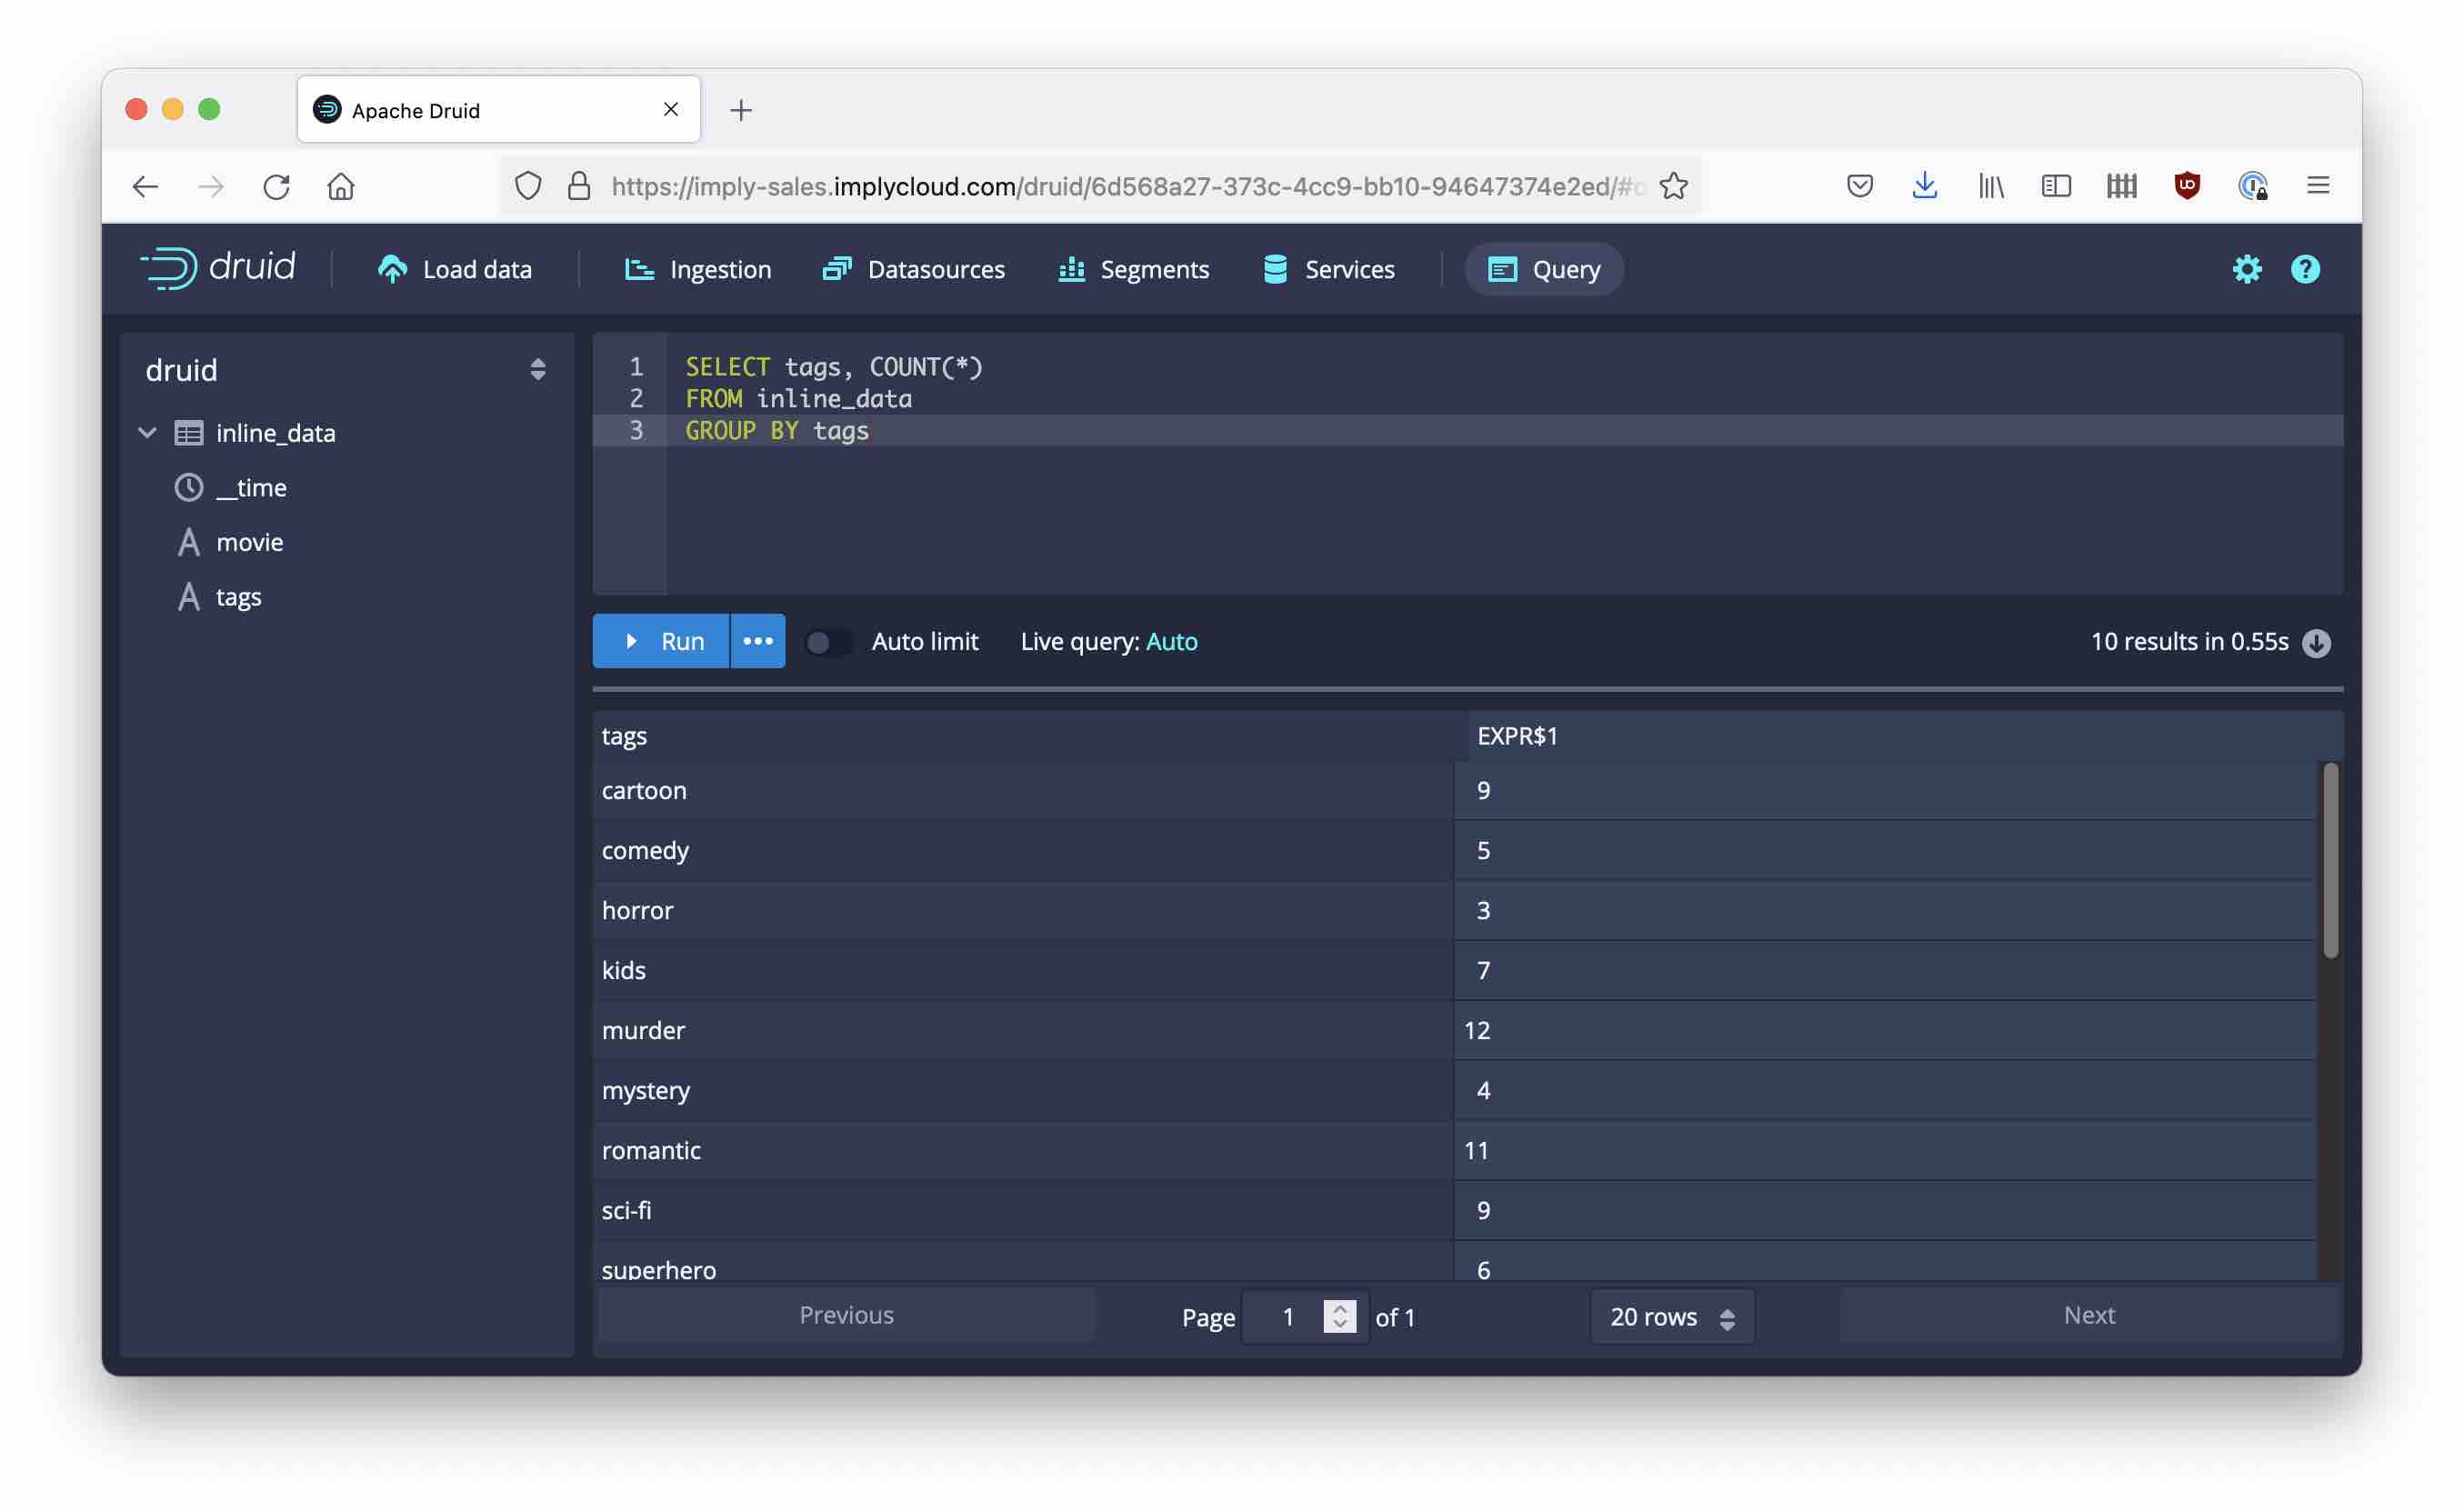
Notice how the tags dimension behaves:
- Each occurrence of a tag is counted in the GROUP BY.
- If the tags field is part of the GROUP BY, individual values are displayed in the SELECT list.
- If a tag value is doubled in a row, it is also counted double. We will figure out in a later post how to influence this behavior.
Let’s try another one:
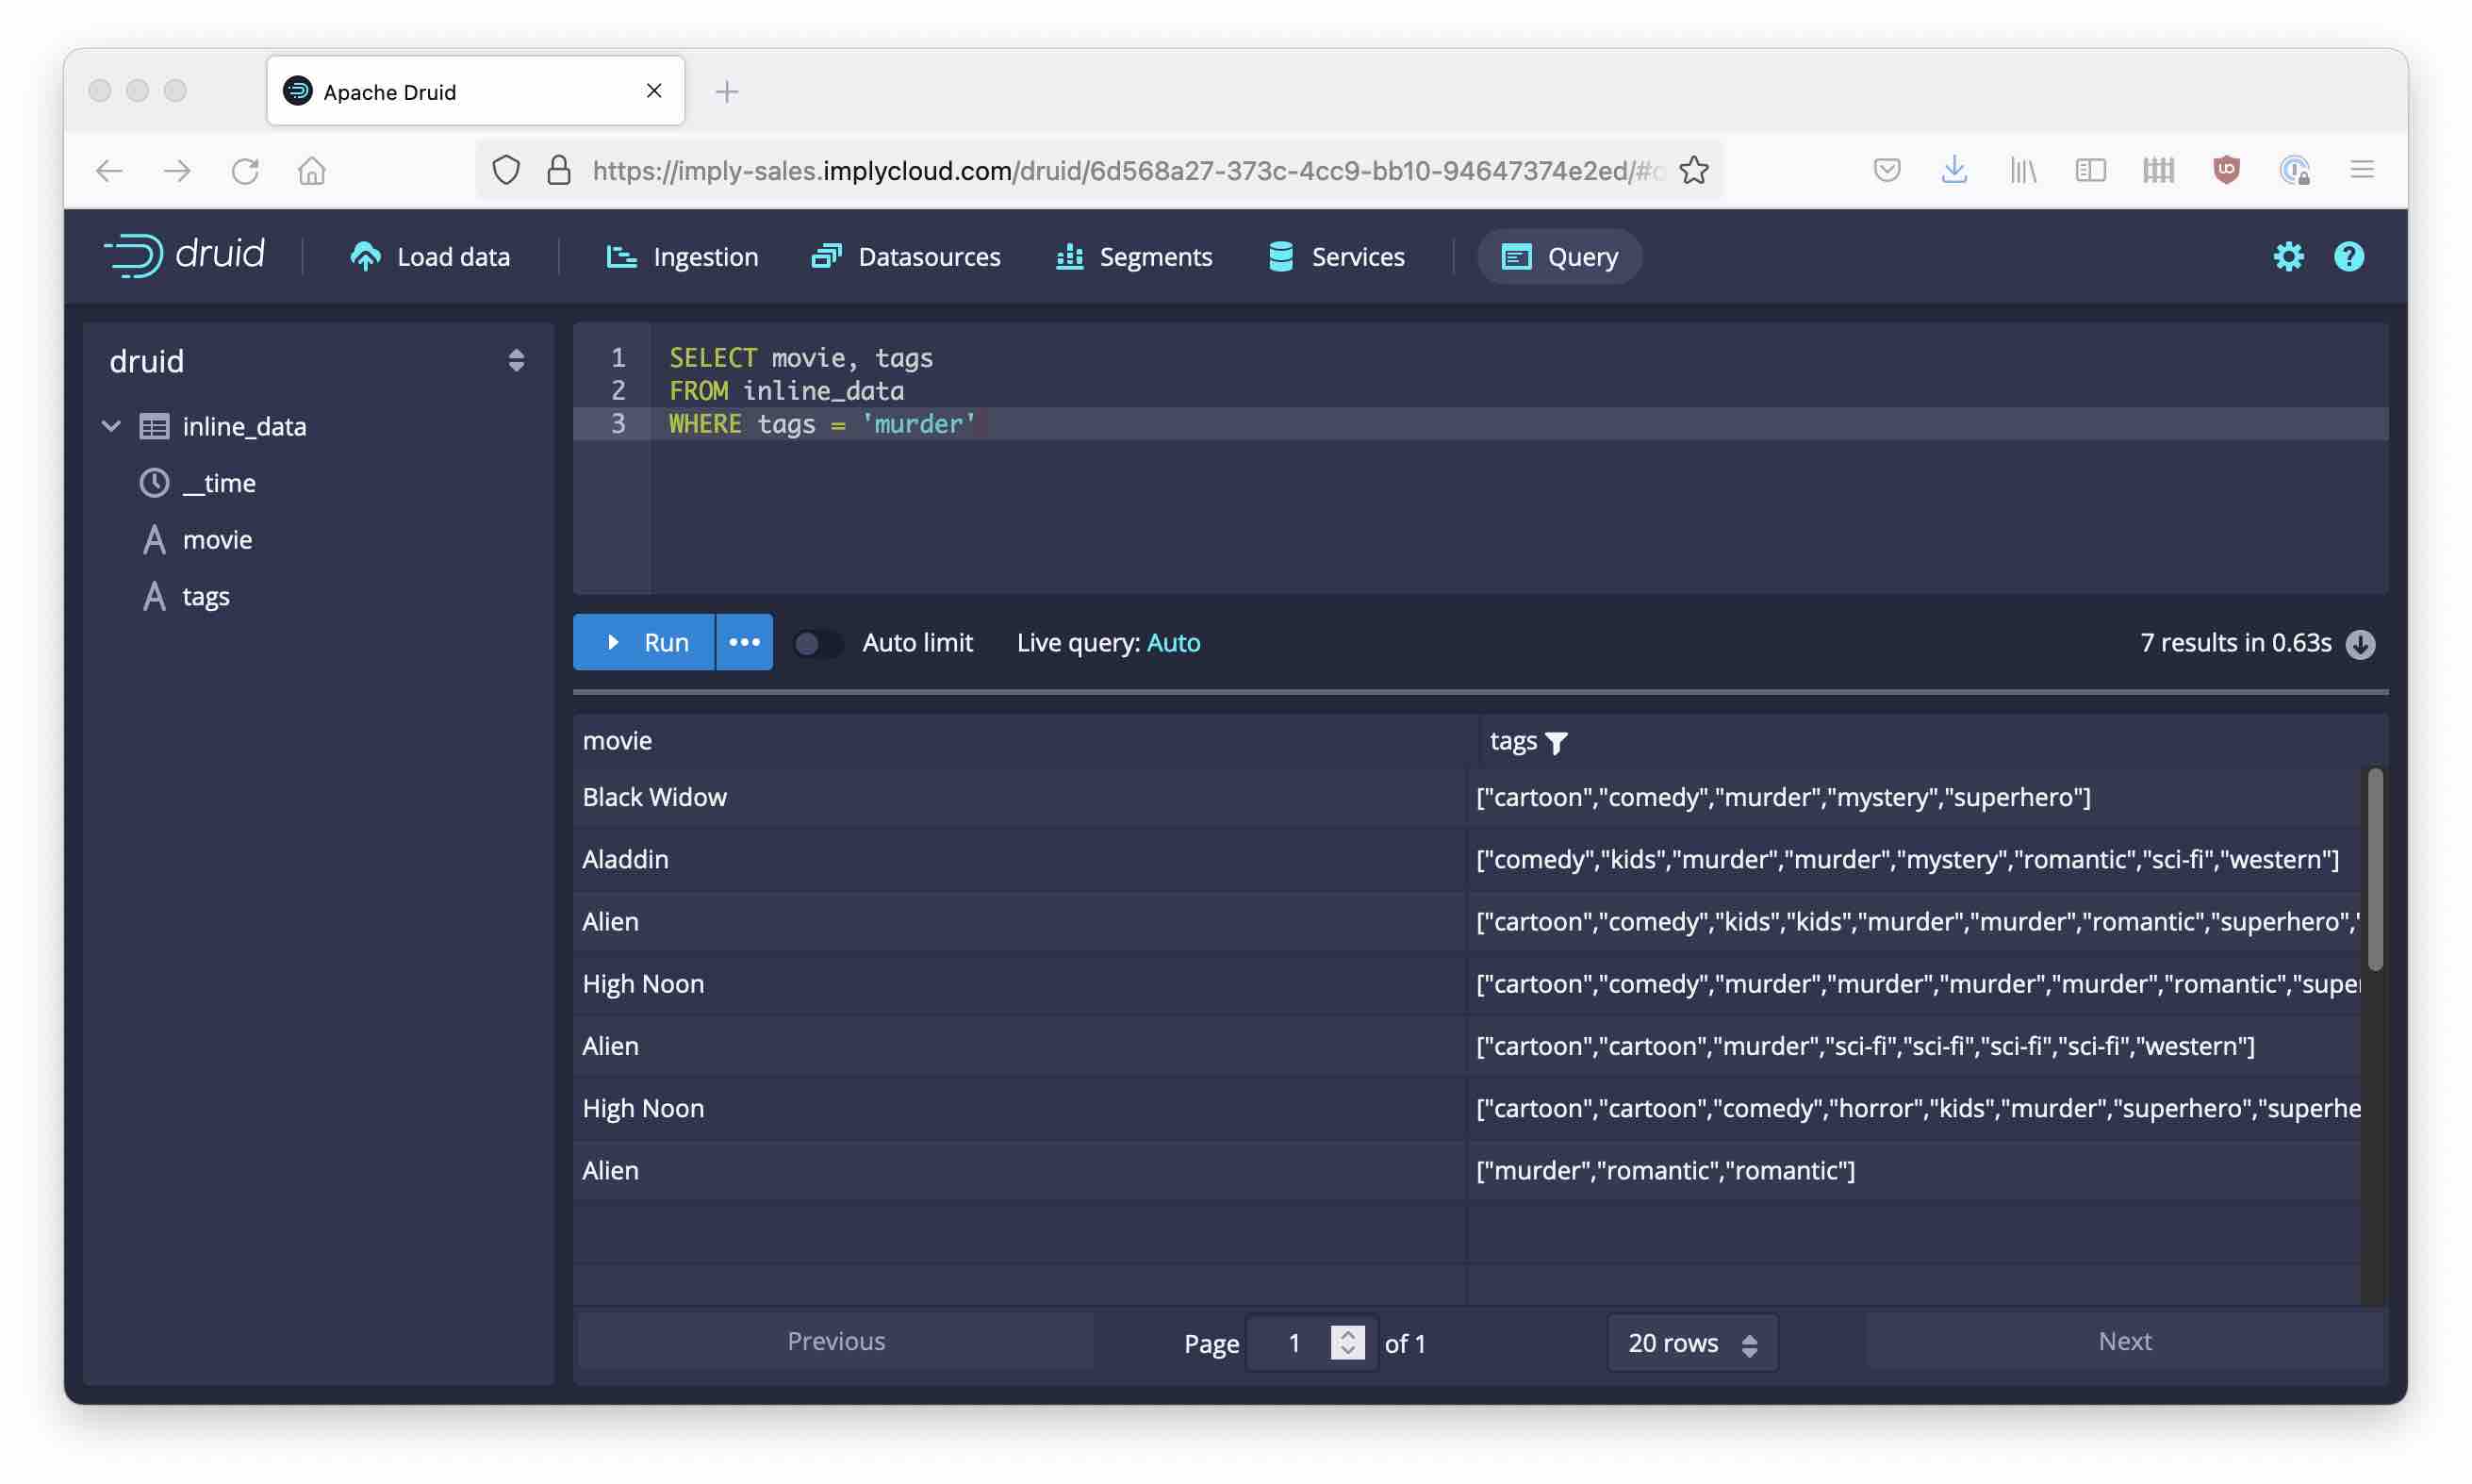
- You can filter by a single value and get all rows where the tag list contains that value.
- In the result, the whole tag list is displayed.
Learnings
- Multi-value dimensions are string lists in a table (kind of).
- Without GROUP BY, they are displayed as lists. But you can filter by single values.
- With GROUP BY, multi-value dimensions behave more as if you have one row for each occurrence of a value.
- We found some hints in the JSON spec that may point to ways to modify the behavior.
Stay tuned for more!